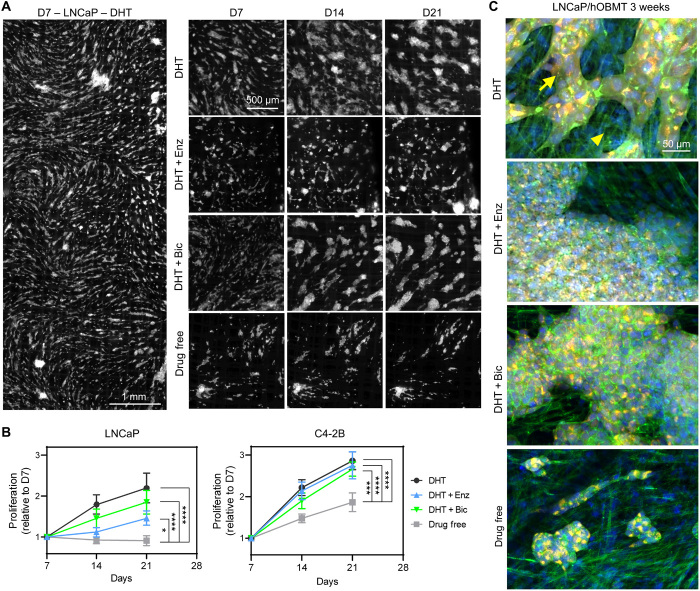
Fig. 6. Antiandrogen treatments only slightly reduce the long-term proliferation of LNCaP micrometastases but have no effect on C4-2B micrometastases in the bone microenvironment.
(A) Epifluorescence images of LNCaP/hOBMT metastatic constructs up to 21 days for various treatments (mKO2 channel shown). (B) LNCaP and C4-2B proliferation on hOBMT, up to 21 days, normalized to the area of cancer cells on hOBMT at day 7 (D7), n = 4 to 5, means ± SE shown. (C) Confocal microscopy images of metastatic microtissues after 21 days coculture under various treatments [DHT, 10 nM; Enz (enzalutamide), 10 μM; Bic (bicalutamide), 10 μM], showing merged images from DAPI (blue), phalloidin (green), and cancer cells (mKO2, red). Full arrows show cancer cells. Arrowheads show osteoblasts (MaxProj. shown, 70-μm z-stacks). *P < 0.05, ***P < 0.001, and ****P < 0.0001.

