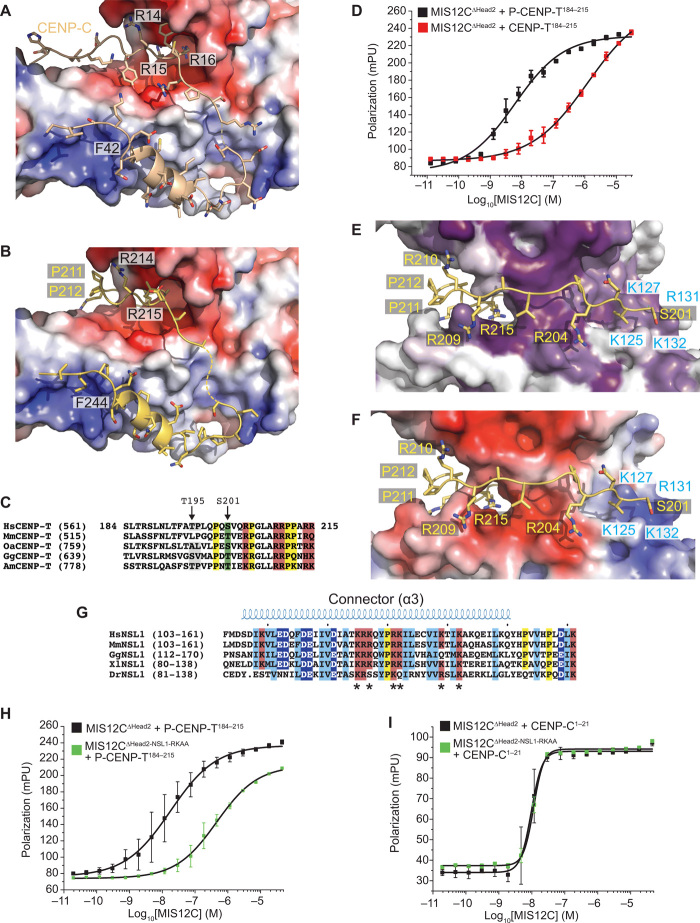
Fig. 7. Structural basis of CENP-T:MIS12C interaction.
(A) Surface electrostatics displayed on the MIS12 complex at the interface with CENP-C (wheat). (B) Structural model of the CENP-T peptide (residues 213 to 249) interaction with the MIS12C using the CENP-C N-terminal region as a template (PDB ID 5LSK) and the sequence alignment shown in Fig. 6F. CENP-T was modeled on the same interface. (C) Multiple sequence alignment of CENP-T in the unique region containing the Thr195 and Ser201 phosphorylation sites and encompassing the modeled residues (201 to 212) shown in (E) and (F), which precede the region aligned on CENP-C (Fig. 6F). (D) Binding isotherms by fluorescence polarization obtained with the indicated fluorescent S201-phosphorylated or nonphosphorylated CENP-T peptides and the MIS12C∆Head2 mutant complex. (E) Structural model of the CENP-T201–212:MIS12C interaction and the MIS12C surface conservation of residues lining the possible CENP-T binding site. (F) Charge distribution on the same interface discussed in (H). (G) Sequence analysis of the connector region of NSL1 pinpointing multiple conserved positively charged residues potentially involved in the phospho-dependent recognition of CENP-T. (H) Binding isotherms by fluorescence polarization obtained with the indicated fluorescent S201-phosphorylated peptide and the MIS12C∆Head2 control complex or the MIS12C∆Head2 with alanine mutations at Arg131NSL1 and Lys132NSL1. (I) As in (H) but with a fluorescent CENP-C1–21 peptide.

