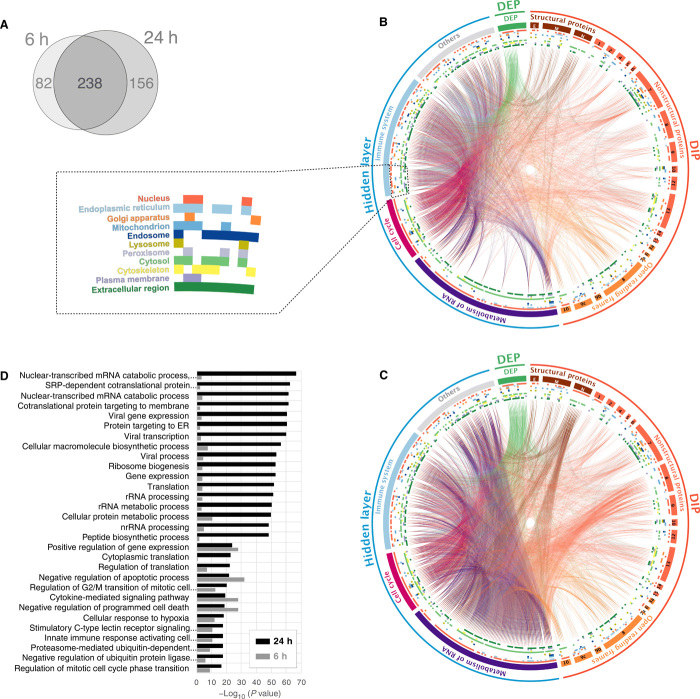
Fig. 2. SARS-CoV-2 viral protein subnetwork analysis shows an enrichment of viral replication pathways.
(A) Venn diagram of key proteins in 6- and 24-hour SIP networks. (B) A circos plot depicting interactions between DIPs and DEPs revealed through the SIP network at 6 hours after infection. DIPs were subdivided into the genomic organization of SARS-CoV-2. Proteins in the hidden layer were also subdivided into major pathways. Inner colored circles demonstrate the subcellular localization of the proteins, and details are shown in the dotted box. The colored lines show PPI. (C) Twenty-four hours after infection. (D) Top 30 enriched GO terms of the key proteins in the SIP network at 24 hours (black). The enrichment P values of 30 terms at 6 hours are also shown as a control (gray).

