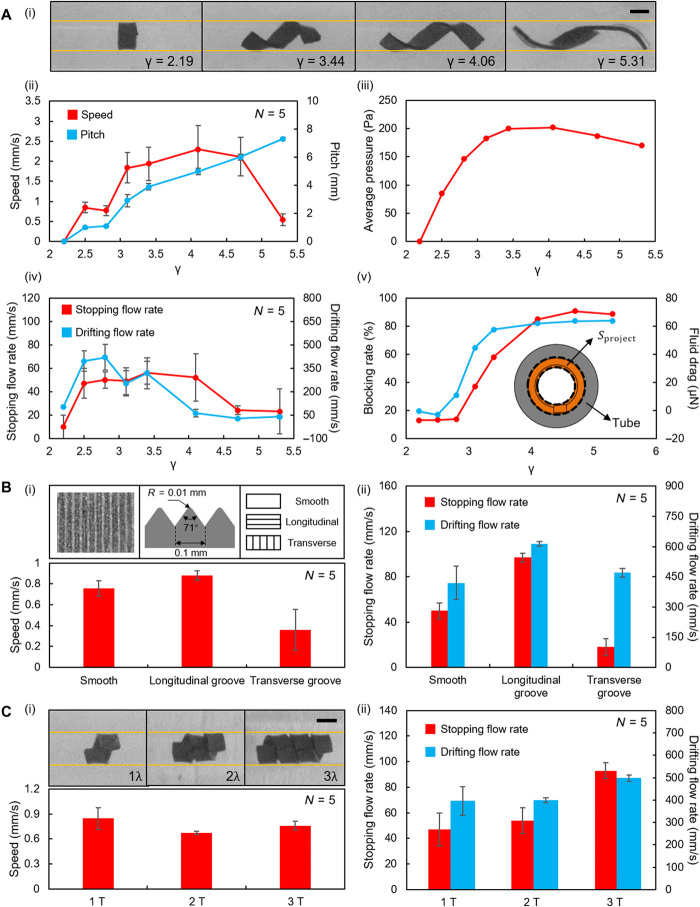
Fig. 6. The factors that influence the helical surface crawling performance in experiments.
(A) The influence of γ on helical surface crawling performance. (i) The deformation of the robot at different γ. (ii) The pitch length and crawling speeds achieved at different γ. (iii) Simulation results of the variation of the average pressure with varying γ. (iv) The stopping and drifting flow rates achieved at different γ. (v) Simulation analysis of the influence of γ on the blocking ratio and the fluid drag. (B) The influence of the robot surface grooves on helical surface crawling performance. (i) The crawling speeds achieved at different groove orientations. The optical microscope image and dimension and orientation schematics of the grooves are shown in the small insets. (ii) The stopping and drifting flow rates achieved by different grooved patterns. (C) The influence of creating multiwavelength sinusoidal magnetization profiles. (i) The crawling speeds obtained at different numbers of periods show no significant difference [ANOVA, F(2,16) = 2.381, P = 0.124]. The helical shapes formed by the robots with multiwavelength sinusoidal magnetization profiles are shown in the small insets. (ii) The stopping and drifting flow rates at different numbers of periods. In (A) to (C), the yellow lines indicate the position of the boundaries. N is the number of trials in each case. The error bars stand for the error of the mean. Scale bars, 1 mm. Photo Credits: Ziyu Ren, Max Planck Institute for Intelligent Systems.

