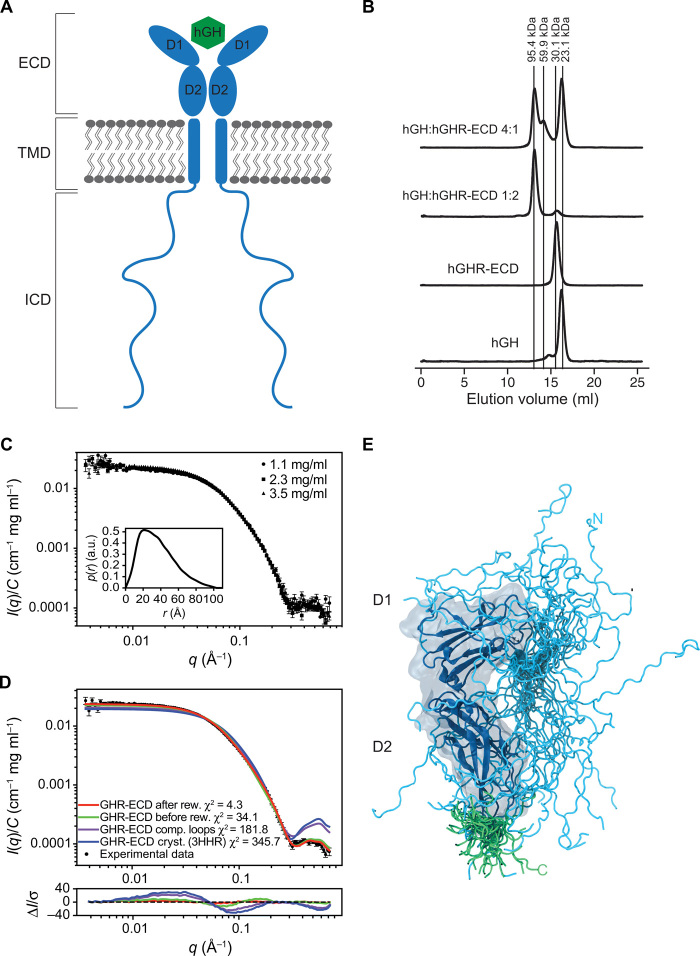
Fig. 1. The hGHR has a dynamic ECD with a broad structural ensemble.
(A) A schematic representation of homodimeric hGHR (blue) in the membrane in complex with hGH (green). ECD, Extracellular domain; TMD, transmembrane domain; and ICD, intracellular domain. (B) SEC profiles of hGHR-ECD and hGH in 20 mM Na2HPO4/NaH2PO4 (pH 7.4) and 150 mM NaCl at ratios 1:0 (hGH:hGHRECD 1:0), 0:1 (hGH:hGHR-ECD 0:1), 1:2 (hGH:hGHR-ECD 1:2), and 4:1 (hGH:hGHR-ECD 4:1). Absorption was measured at 280 nm. (C) Concentration-normalized SAXS data from hGHR-ECD (concentrations in legend) with the p(r) from the sample (3.5 mg/ml) shown as inset. a.u., absorbance units. (D) SAXS data from hGHR-ECD at 3.5 mg/ml (black dots) together with fits of the theoretical scattering curves from a crystal structure of hGRH-ECD (blue; PDB 3HHR), the same crystal structure with missing loops completed (purple), and the average (green) and reweighted average [red; reweighted against the experimental data using the Bayesian maximum entropy approach (see Materials and Methods)] of scattering curves of the 500 hGHR-ECD models with added N- and C-terminal tails. Residuals are plotted below. (E) An ensemble model of the hGHR-ECD with a representative reweighted subensemble of 100 models highlighting the N-terminal (cyan) and C-terminal (green) dynamic tails.

