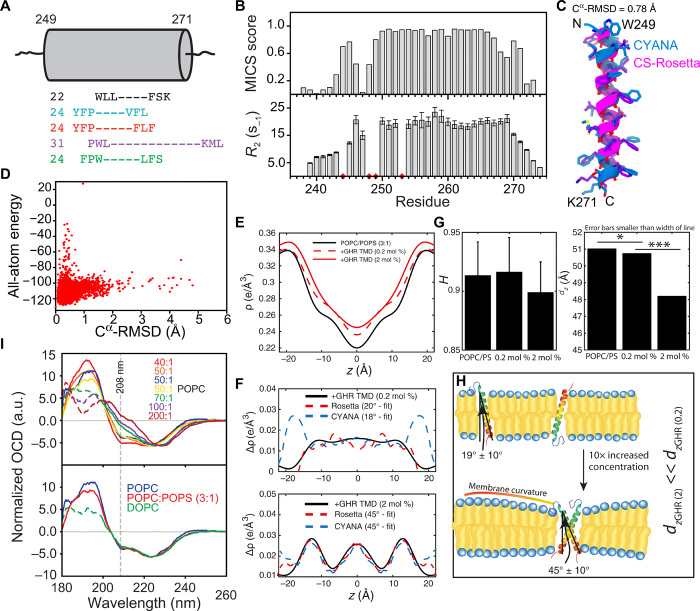
Fig. 2. The single-pass α-helical hGHR-TMD.
(A) Extent of the hGHR-TMD α helix by NMR (black), TMHMM (blue), Phobius (red), METSAT-SVM (purple), and UniProt (green) (fig. S2). Cylinder represents length of the hGHR-TMD α helix by NMR with the first and last helical residue numbered. (Left) Predicted numbers. (B) MICS α helix probability (top) and R2 relaxation rates (bottom) of hGHR-TMD in DHPC micelles. Red diamonds, insufficient data quality or prolines. (C) Models of hGHR-TMD α helix by CYANA (blue) or CS-Rosetta (magenta). (D) Energy versus Cα-RMSD from CS-Rosetta modeling of hGHR-TMD. (E) Electron density profiles (EDPs) of lipid bilayers [POPC:POPS 3:1 mole percent (mol %)] with hGHR-TMD at 0.2 and 2 mol %, respectively. (F) Difference EDPs and best-fit profiles for the hGHR-TMD CS-Rosetta and the CYANA models, respectively. (G) Hermans orientation (left) and Lamellar spacing (right) of membranes at varying concentrations of hGHR-TMD. *, onefold change; ***, threefold change. (H) Illustration of membrane curvature. (I) Top: Oriented CD (OCD) spectra of 6 μg of hGHR-TMD in POPC, with L:P ratios varied from 1:40 to 1:200. Bottom: OCD spectra of 6 μg of hGHR-TMD in POPC, POPC:POPS (3:1), or DOPC at an L:P ratio of 50:1. The dashed lines represent nonreliable data due to too high high-tension voltage values.

