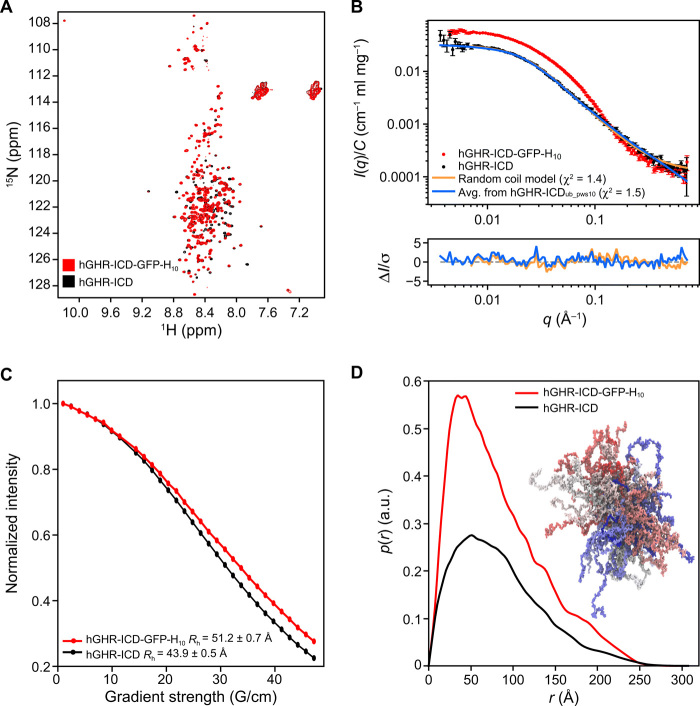
Fig. 3. Properties of the hGHR-ICD ensemble.
(A) 1H-15N-HSQC spectra at 5°C of hGHR-ICD (black) and hGHR-ICD-GFP-H10 (red) at 150 and 100 μM, respectively. (B) Concentration normalized SAXS data from hGHR-ICD (black dots; 1.1 mg/ml) and hGHR-ICD-GFP-H10 (red dots; 2.2 mg/ml). Fits to the data are shown for a Gaussian random coil model (orange) and from averaged scattering profiles from 5200 conformations taken from the hGHR-ICDub_pws10 simulation (one every nanosecond) (blue). Residuals are plotted below. (C) RH of hGHR-ICD and hGHR-ICD-GFP-H10 determined from pulse-field gradient NMR. Signal decays of hGHR-ICD (black) and hGHR-ICD-GFP-H10 (red) are shown as a function of gradient strength together with the corresponding fits. (D) Concentration normalized p(r)’s derived from the above SAXS data from hGHR-ICD (black) and hGHR-ICD-GFP-H10 (red). A subensemble of 200 conformations representative of the hGHR-ICDmetaD_pws10 simulation is shown in the right side of the plot.

