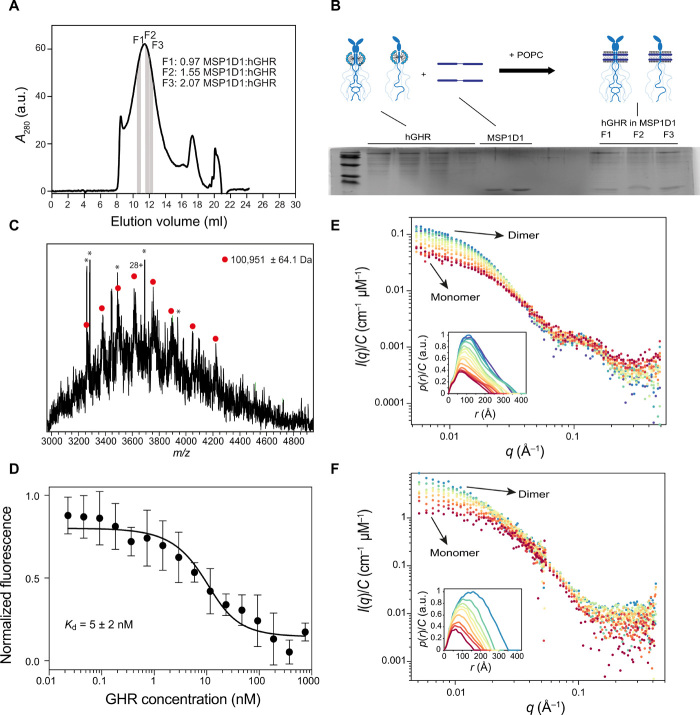
Fig. 4. Incorporation of hGHR-GFP into MSP1D1, functional, and structural analysis.
(A) SEC profile of hGHR-GFP-loaded MSP1D1. The areas highlighted in gray indicate fractions (F1 to F3) used for the SDS-PAGE analysis in (B). (B) SDS-PAGE analysis of hGHR-GFP and MSP1D1 standards along with hGHR-GFP-loaded MSP1D1. Fractions F1 to F3 were taken from the indicated positions of the SEC-purified hGHR-GFP-loaded MSP1D1 shown in (A). The illustration above the gel shows the stoichiometry of the hGHR-GFP-loaded MSP1D1. (C) Intact mass spectra of hGHR-GFP show a single protein population with an average mass of 100,951 ± 64 Da. Asterisks denote detergent peaks. (D) MST determination of equilibrium binding constants for hGH to hGHR-GFP-loaded MSP1D1. The mean values and SD were obtained by fitting a 1:1 binding model (full line) as described in Materials and Methods. Concentration-normalized (E) SAXS data and (F) SANS data of the nanodisc-embedded hGHR-GFP corresponding to the highlighted SEC frames in fig. S4 (C and D).

