
Figure 2:
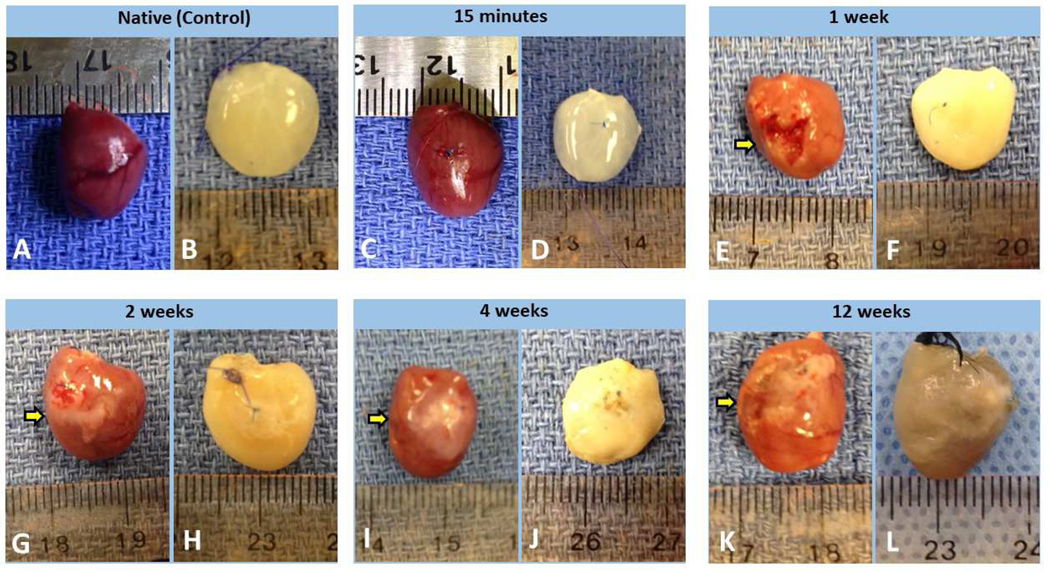
Photos taken before decellularization and after decellularization of rat hearts from each time point post-MI. Native (control) group before (A) and after (B) decellularization; 15M post-MI group before (C) and after (D) decellularization; 1W scar group before (E) and after (F) decellularization; 2W scar group before (G) and after (H) decellularization; 4W scar group before (I) and after (J) decellularization; 12W scar group before (K) and after (L) decellularization. The MI-induced scar tissue with pale whitish color was labeled with Arrows in panel E, G, I, and K.