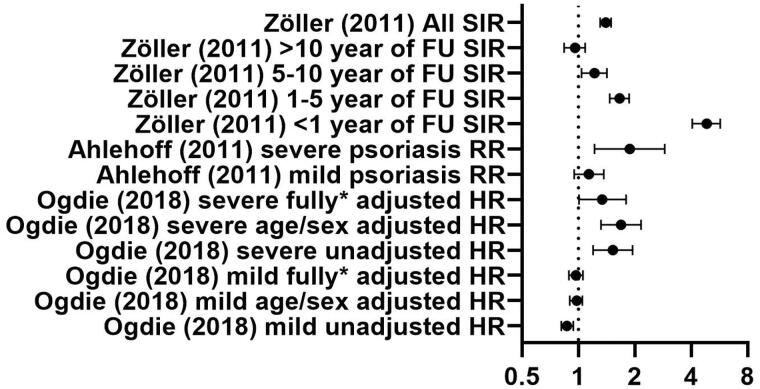
Figure 4.
Overview of reported ratios of the included studies on PE. Dots show SIR (standardized incidence ratio), RR (Rate Ratio) , HR (hazard ratio); lines represent 95% confidence interval; * shows adjustment for sex, age, hypertension, history of cancer, joint replacement in the baseline period, hospitalization in the baseline period, chronic obstructive pulmonary disease, liver disease, oral glucocorticoids, NSAIDs, smoking and drinking in the baseline period.

