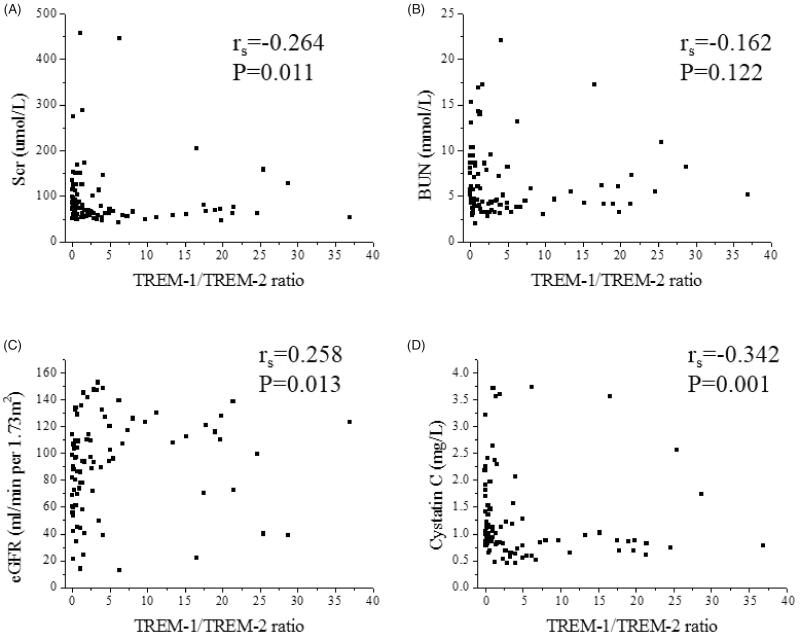
Figure 5.
Correlation between urinary TREM-1/TREM-2 ratio and clinical parameters. (A) Spearman correlation between TREM-1/TREM-2 ratio and Scr (rs= −0.264, p = .011). (B) Spearman correlation between TREM-1/TREM-2 ratio and BUN (rs= −0.162, p = .122). (C) Spearman correlation between TREM-1/TREM-2 ratio and eGFR (rs=0.258, p = .013). (D) Spearman correlation between TREM-1/TREM-2 ratio and cystatin c (rs= −0.342, p = .001).

