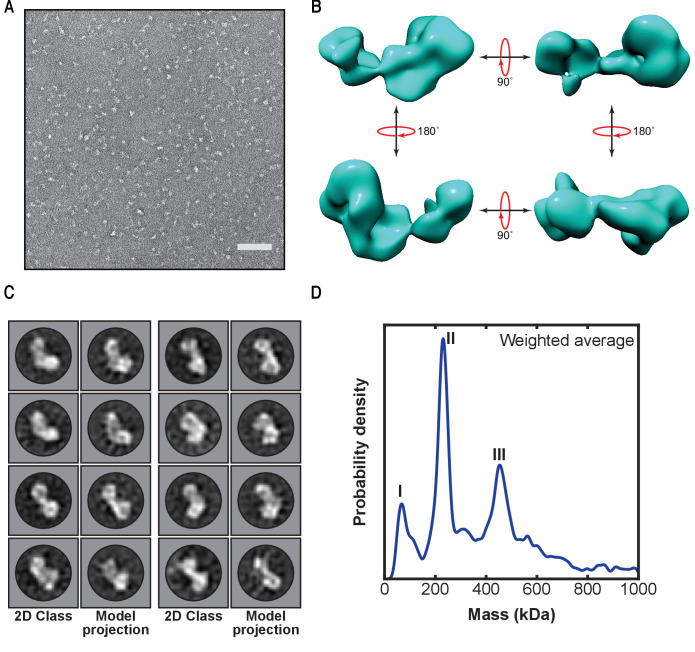
Figure 2. First low-resolution 3D map of linear ubiquitin chain assembly complex (LUBAC) obtained by negative staining electron microscopy of the recombinant complex.
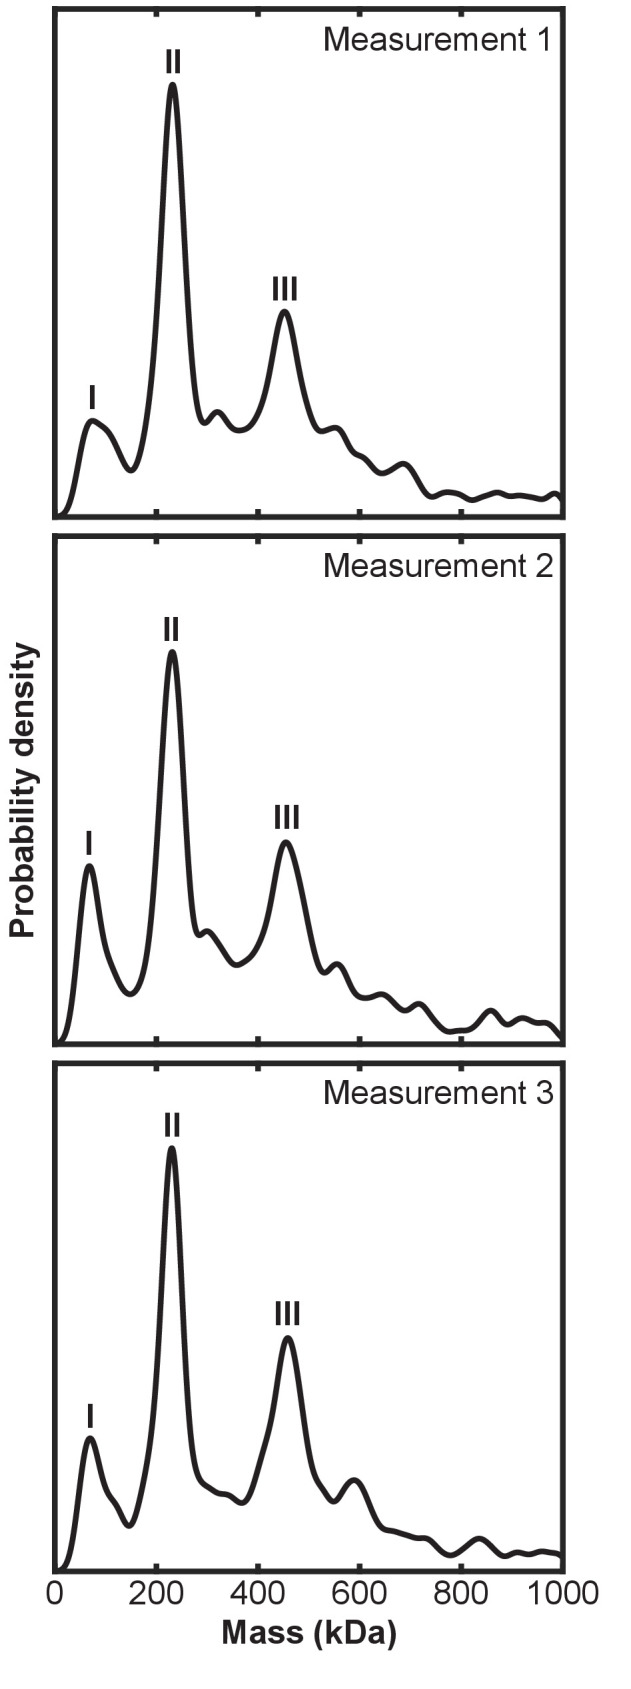
(A) Representative negative stain transmission electron micrograph of recombinant LUBAC. Scale bar: 100 nm. (B) 3D refined model of LUBAC obtained by single particle analysis of negative stained electron micrographs. (C) LUBAC 2D class averages matched to projections made from 3D refined map. (D) Mass photometry measurements of LUBAC indicate formation of a ternary complex with 1:1:1 stoichiometry that can form dimers.
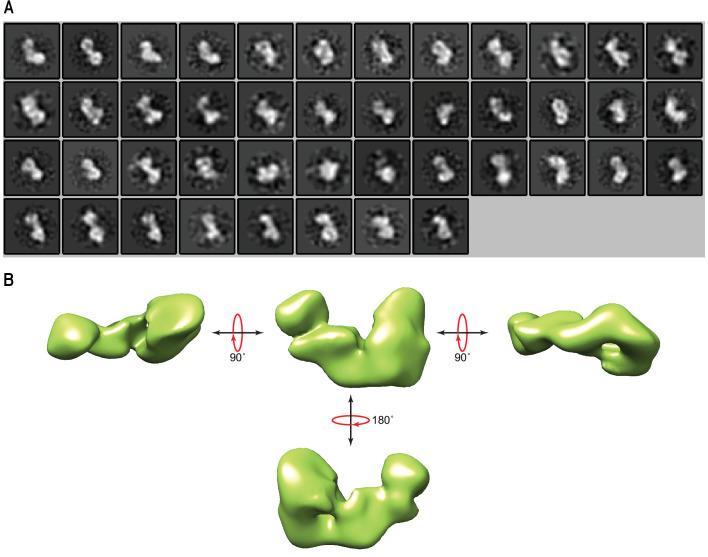
Figure 2—figure supplement 1. Modelling of the linear ubiquitin chain assembly complex (LUBAC) by negative staining electron microscopy.
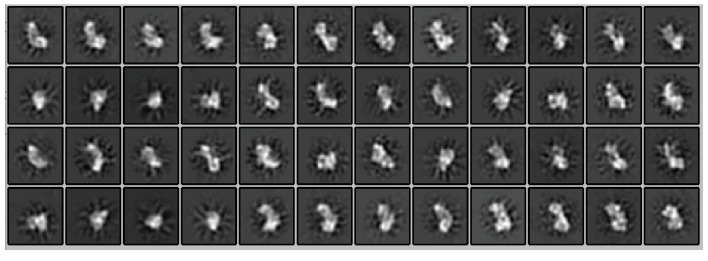
Figure 2—figure supplement 2. Projections made from 3D refined model of linear ubiquitin chain assembly complex (LUBAC).
Figure 2—figure supplement 3. Independent mass photometry measurements of linear ubiquitin chain assembly complex (LUBAC).


