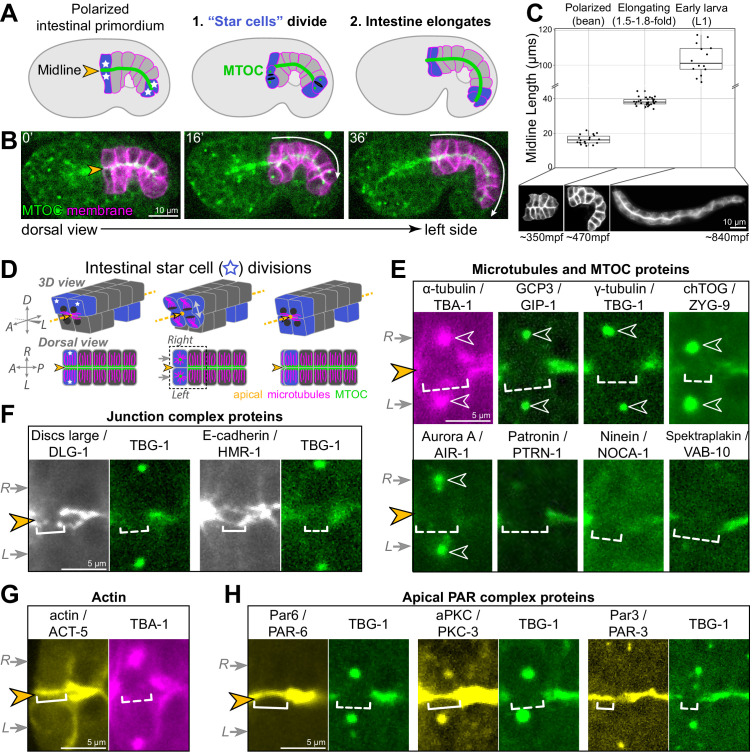
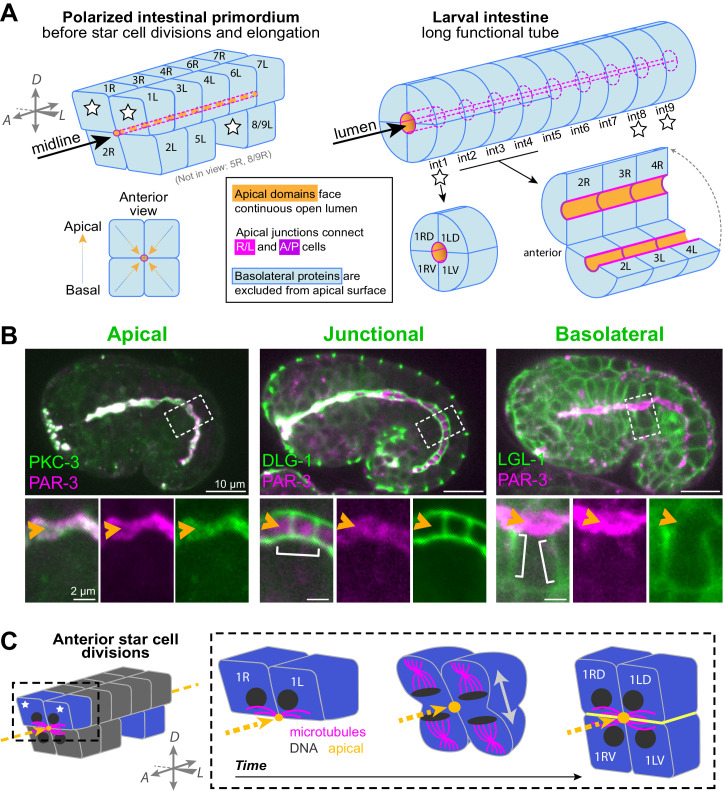
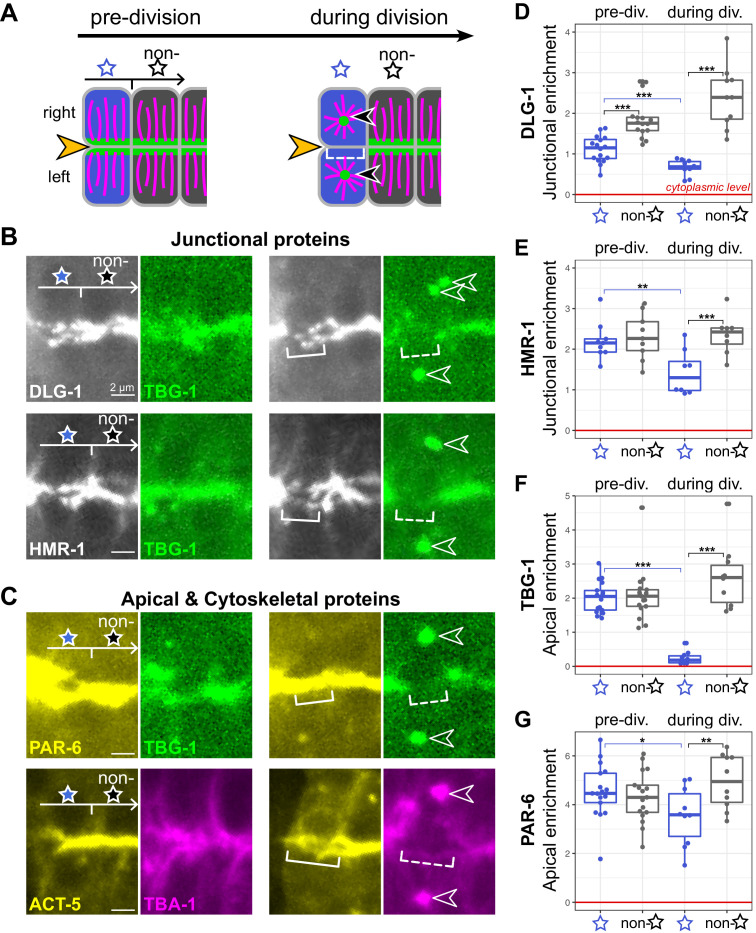
Figure 1. Cell division and elongation challenge the epithelial integrity of the developing C. elegans intestine.
(A, B) A cartoon schematic (A) and corresponding live time course (B) of an embryo expressing an apical microtubule-organizing center (MTOC) marker TBG-1::mCherry (green, orange arrowhead) and a membrane marker intestinal GFP::CAAX (magenta); the anterior and posterior ‘star cells’ divide (blue) and the apical surface elongates (white arrow) as the polarized intestinal primordium develops into an intestine. (C) Top: graph showing intestinal apical length in newly polarized primordia (bean stage, average length = 16.5 ± 2.6 μm, n = 18), ~1.5–2 hr after the start of intestinal elongation (1.5-fold to 1.8-fold, average length = 38.2 ± 2.2 μm, n = 30), and upon hatching in the L1 larval stage (average length = 105.0 ± 11.1 μm, n = 15). Below: corresponding intestinal GFP::CAAX images and approximate age, in minutes post-fertilization (mpf). (D) Cartoon schematic of the anterior star cell divisions illustrating their dorsoventral division in 3D (top) and from a dorsal view (bottom). Dotted line indicates viewing angle of images in (E–H). (E–H) Live imaging of indicated proteins relative to TBG-1/γ-tubulin::mCherry (green) or mCherry::TBA-1/α-tubulin (magenta) and the midline (orange arrowhead) when the right and left cells divided synchronously (gray arrows). Note that in some cases a midline gap (dashed bracket) formed, and in other cases no gap formed (solid bracket). Numbers of embryos with midline gaps in mitotic star cells, assessed by eye: mCherry::TBA-1 (5/5), ZF::GFP::GIP-1 (5/5), TBG-1::mCherry (10/10), mCherry::AIR-1 (10/10), ZYG-9::ZF::GFP (3/3), PTRN-1::GFP (5/5), NOCA-1::ZF::GFP (7/7), VAB-10B::GFP (3/3), HMR-1::GFP (0/8), DLG-1::mNG (1/8), YFP::ACT-5 (0/6), PAR-6::GFP (0/10), GFP::PKC-3 (0/5), and PAR-3::GFP (0/5). All images are maximum intensity Z-projections (0.5–1.5 μm) that capture centrosomes (open white arrowheads) and/or the intestinal midline. Scale bar = 10 μm in (B, C). Scale bar = 5 μm in (E–H).


