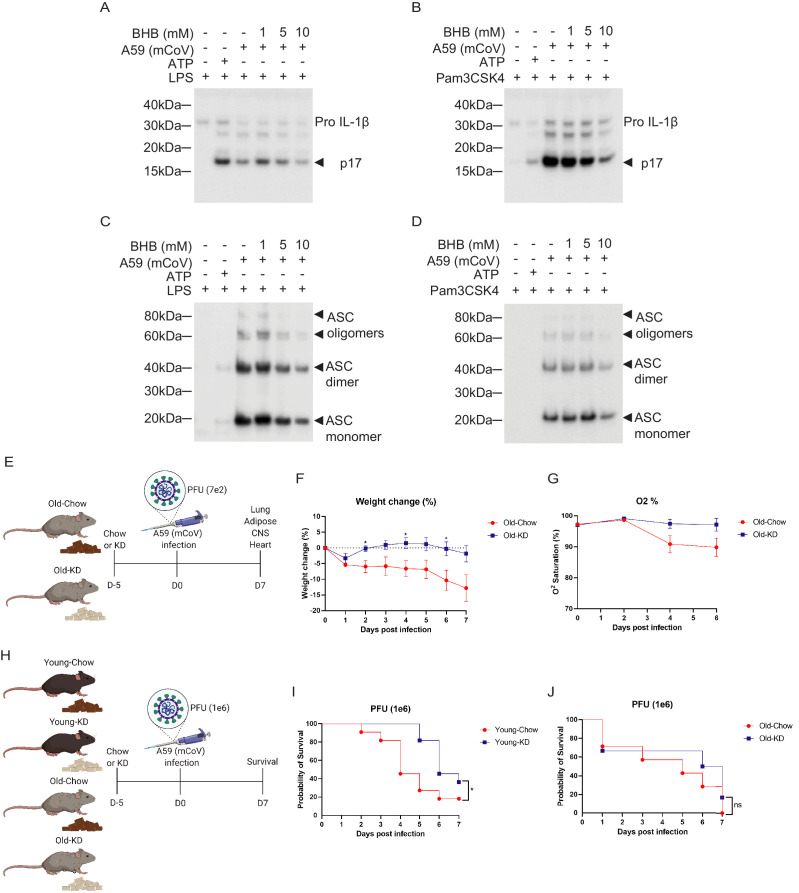
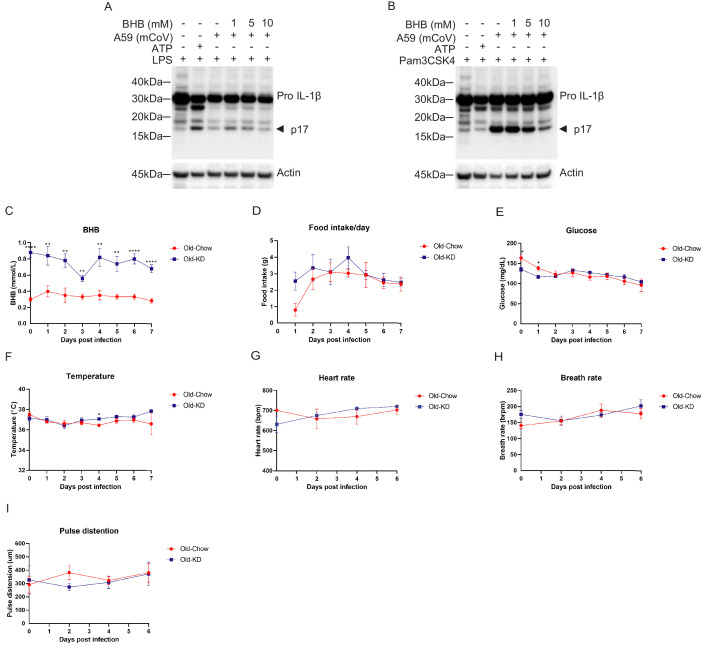
Figure 4. Ketogenic diet reduces the severity of A59 (mCoV) infection in old mice.
(A, B) Western blot analysis about pro and active cleaved p17 form of IL-1β from supernatant of A59 (mCoV)-infected BMDMs co-treated with priming reagents such as LPS (A) and Pam3CSK4 (B), and BHB with indicated concentration. (C, D) Western blot analysis of ASC monomer, dimer, and oligomers from insoluble pellet of A59 (mCoV) infected BMDMs co-treated with priming reagents such as LPS (C) and Pam3CSK4 (D), and BHB with indicated concentration. (E) Schematic of non-lethal dose (PFU 7e2) of A59 (mCoV) infection experiment with old mice (20–21 month) fed chow (Old-Chow, n = 6) or ketogenic diet (Old-KD, n = 5). The mice were provided with diet from 5 days before infection. (F, G) After infection, the phenotype was evaluated until 7 days post-infection. Weight change (%) (F), and % O2 saturation (G) in old mice fed chow or KD. (H) Schematic of lethal dose (PFU 1e6) of A59 (mCov) infection experiment with young (4 months) and old (24 months) mice fed chow (Young-Chow, n = 11; Old-Chow, n = 7) or KD (Young-KD, n = 11; Old-KD, n = 6). The mice were provided with diet from 5 days before infection. After infection, the survival was evaluated until 7 days post-infection. (I) Probability of survival of lethal dose A59 (mCoV)-infected young mice fed chow or KD. (J) Probability of survival of lethal dose A59 (mCoV)-infected old mice fed chow or KD. Error bars represent the mean ± S.E.M. Two-tailed unpaired t-tests were performed for statistical analysis. Gehan–Breslow–Wilcoxon tests were performed for survival analysis. *p<0.05.


