. 2021 Jun 23;10:e70339. doi: 10.7554/eLife.70339

Figure 1. Overall distribution of loss of heterozygosity (LOH) in the 169 mutation accumulation (MA) lines.

(A) LOH event tract size distribution across all 169 MA lines, the average tract sizes of the interstitial LOH (I-LOH) events (7.4 kb) and terminal LOH (T-LOH) events (55.3 kb), respectively. The global average LOH event size was 14.1 kb. (B) Violin plot of the LOH event counts in the MA lines population, I-LOH events were found to be significantly greater than T-LOH events (Wilcoxon test, p<2×10⁻¹⁶). (C) Distribution of MA lines based on the proportion of genome under LOH (%), dashed line indicates average proportion of genome under LOH across the 169 MA lines, 15.9% (±1.86).

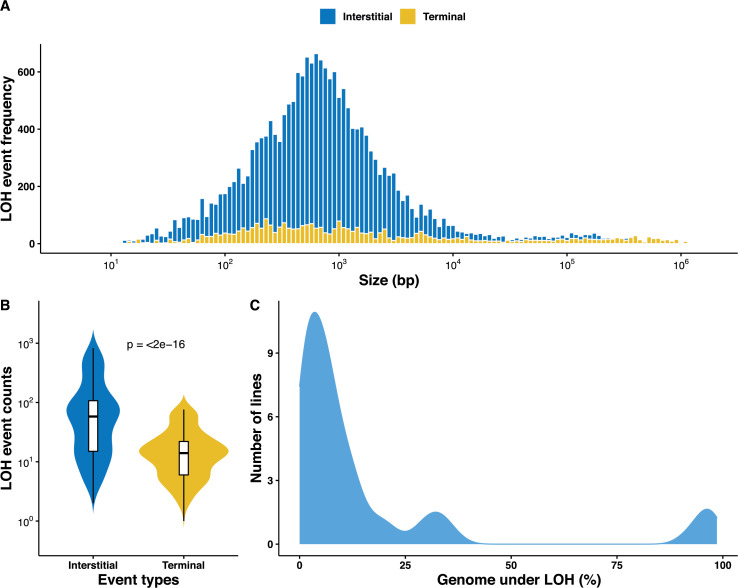
Figure 1.

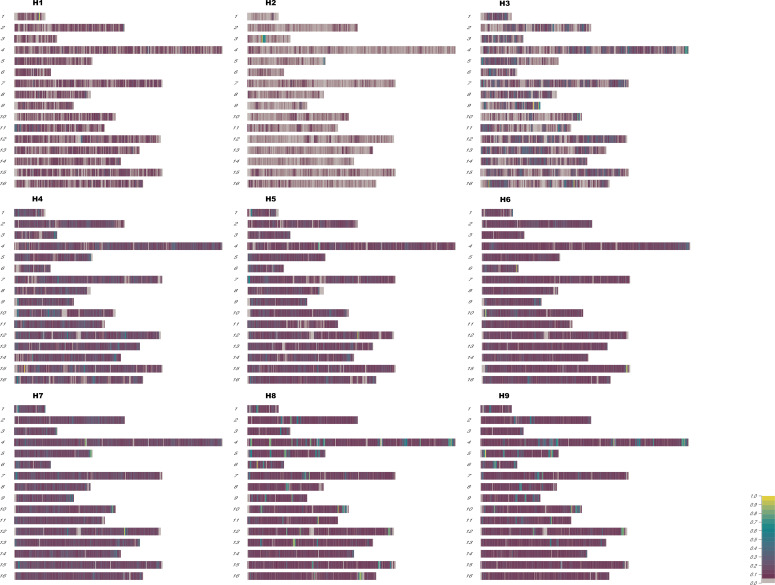
Figure 1—figure supplement 1. Distribution of the heterozygous single nucleotide polymorphism (SNP) densities as a fraction of total heterozygous SNPs in 5 kb windows across the ancestral diploids as described in Table 1.

Figure 1—figure supplement 1.

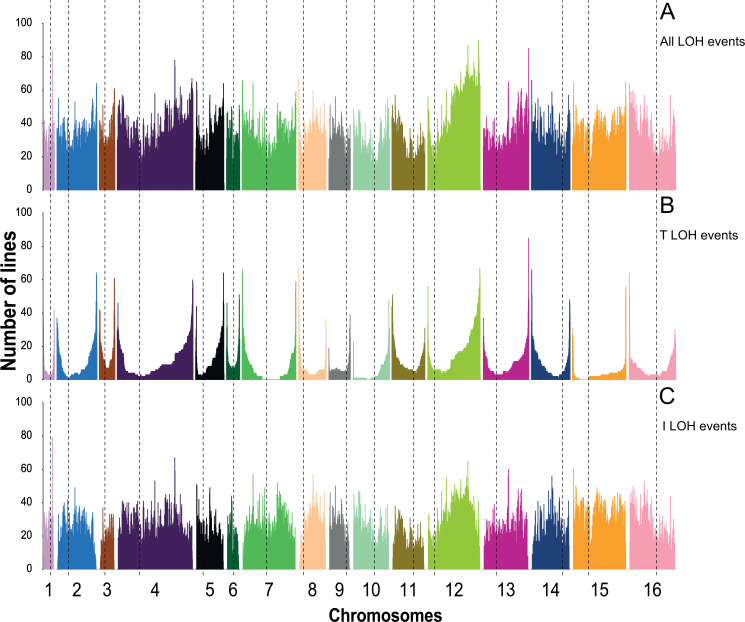
Figure 1—figure supplement 2. Chromosome-wide distribution of loss of heterozygosity (LOH) events across all mutation accumulation (MA) lines.

Figure 1—figure supplement 2.

(A) All LOH events, (B) terminal LOH (T-LOH), events, and (C) interstitial LOH (I-LOH) events.
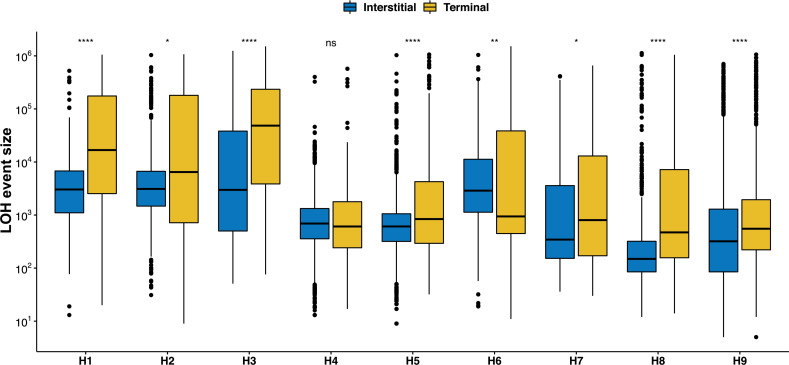
Figure 1—figure supplement 3. A terminal LOH (T-LOH) events are significantly larger than interstitial LOH (I-LOH) in the 169 mutation accumulation (MA) lines all backgrounds except H4 (Wilcoxon test, *p < 0.05; **p < 0.01; ***p<0.001; ****p < 0.0001; ns – not significant).

Figure 1—figure supplement 3.

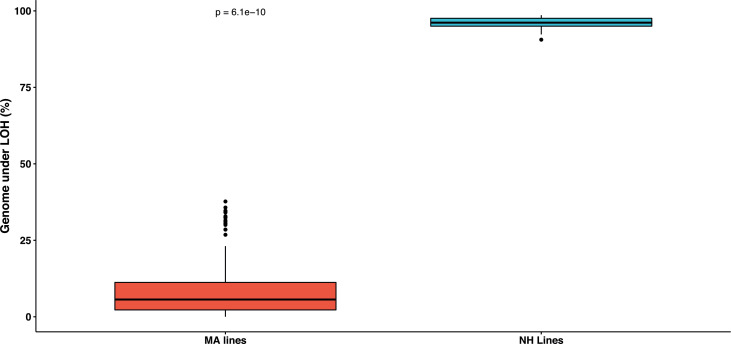
Figure 1—figure supplement 4. Boxplot depicting the fraction genome under loss of heterozygosity (LOH) in the nearly homozygous lines is significantly greater than the rest of the mutation accumulation (MA) lines (Wilcoxon test, p=6.1×10⁻¹⁰).

Figure 1—figure supplement 4.

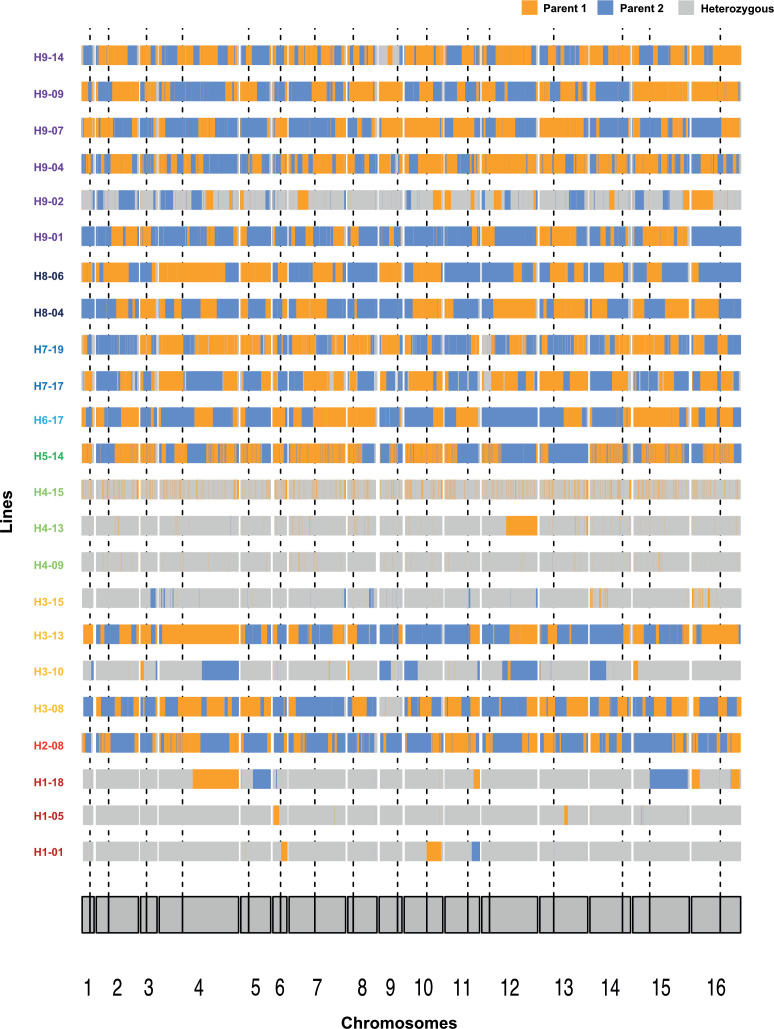
Figure 1—figure supplement 5. Chromosome-wide loss of heterozygosity (LOH) plots across representative lines from H1, H3, H4, and H9.

Figure 1—figure supplement 5.

Orange and blue colors represent single nucleotide polymorphisms (SNPs) fixed toward either of the parents as described in Table 1 and Supplementary file 1. All the 14 nearly homozygous (NH) lines have been depicted. Dotted vertical lines represent position of the centromere.