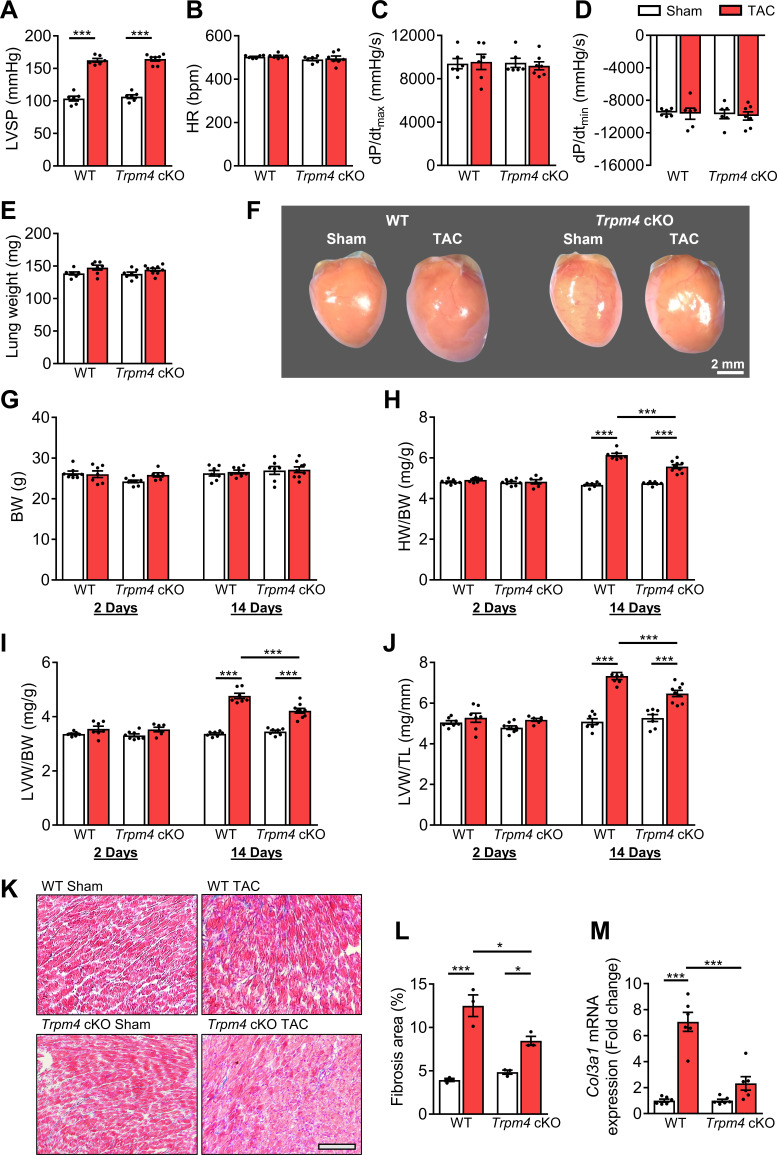
Figure 2. The hypertrophic response of WT and Trpm4 cKO mice to TAC-induced LV pressure overload.
(A) Systolic pressure, (B) heart rate, (C, D) dP/dt after 14 days of sham or TAC in WT and Trpm4 cKO mice. (n = 6–7/group). (E) Lung weight after 14 days of sham or TAC in WT and Trpm4 cKO mice. (n = 7–9/group). (F) Representative photos indicate heart size differences after 14 days of sham or TAC in WT and Trpm4 cKO mice. (G) Body weight, (H) Heart weight, and (I, J) LV weight normalised to body weight and tibia length, in WT and Trpm4 cKO mice after 2 days and 14 days of sham or TAC. (n = 7–9/group). (K) Representative micrographs and (L) quantitation of Masson’s trichrome staining of LV tissue from WT mice and Trpm4 cKO mice after 14 days of sham or TAC (n = 3/group), scale bar = 200 µm in (K). (M) Relative collagen III (Col3a1) mRNA expression after 14 days of sham or TAC. (n = 6/group). The mRNA relative expression was normalised by comparison to GAPDH and calculated as fold change relative to sham in WT and Trpm4 cKO groups, respectively. Results are presented as means ± SEM. *p<0.05, ***p<0.001.

