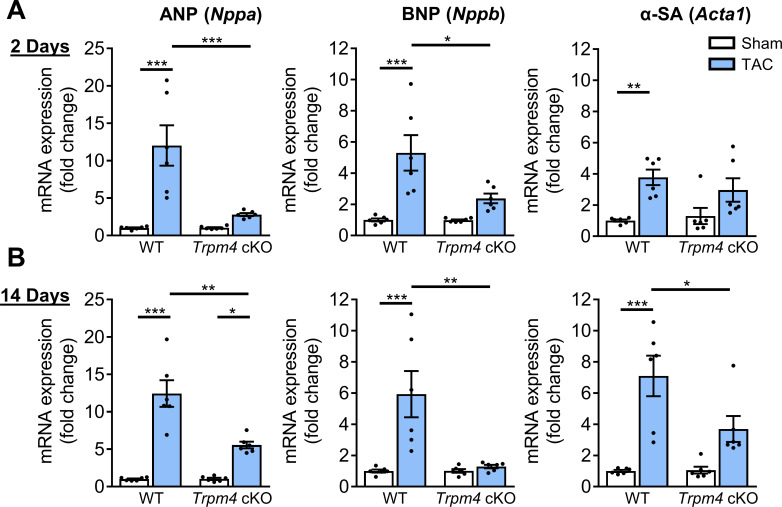
Figure 3. Comparison of gene expression of LVH markers in response to TAC-induced pressure overload in WT and Trpm4 cKO mice.
(A) Relative mRNA expression of ANP (Nppa), BNP (Nppb), and α-SA (Acta1) after 2 days of TAC compared to sham-operated mice. (n = 6/group). (B) Relative mRNA expression of ANP (Nppa), BNP (Nppb), and α-SA (Acta1) after 14 days of sham and TAC. (n = 6/group). The mRNA relative expression was normalised by GAPDH and calculated as fold change relative to WT sham in 2 days and 14 days groups, respectively. Results are presented as means ± SEM, *p<0.05, **p<0.01, ***p<0.001.

