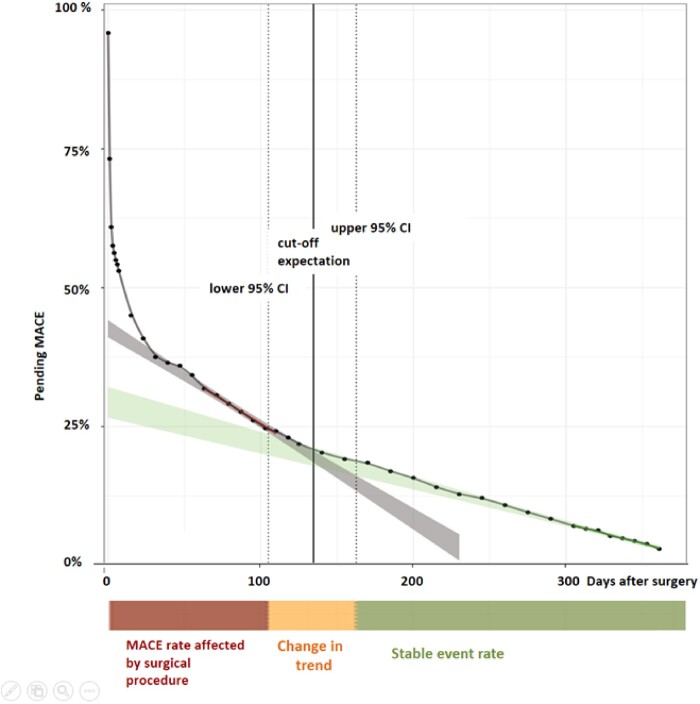
Figure 3.
Time of occurrence of MACE within 365 days of follow-up. The time of occurrence of MACE within 365 days of follow-up shown for the entire patient cohort (n = 2265). Days after surgery on the x-axis, and pending events (in percent) on the y-axis. The green line was derived by linear regression of pending events from postoperative Day 300 to 365, the red line was derived by linear regression of pending events from postoperative Day 30 to 118. 95% confidence intervals (CIs) are shown as ribbons. The intersection area represents the overlap of the derived linear regression lines and their 95% CI. The intersection area is at 135 (95% CI 104–163) days of follow-up and is also shown by the orange coloured bar below with the label ‘Change in trend’. The steeper slope from postoperative Day 0 to 103 is illustrated by the red coloured bar with the label ‘MACE rate affected by the surgical procedure’, and the time period from postoperative Day 164 to 365 is illustrated by the green coloured bar with the label ‘stable event rate’. MACE, major adverse cardiac events.

