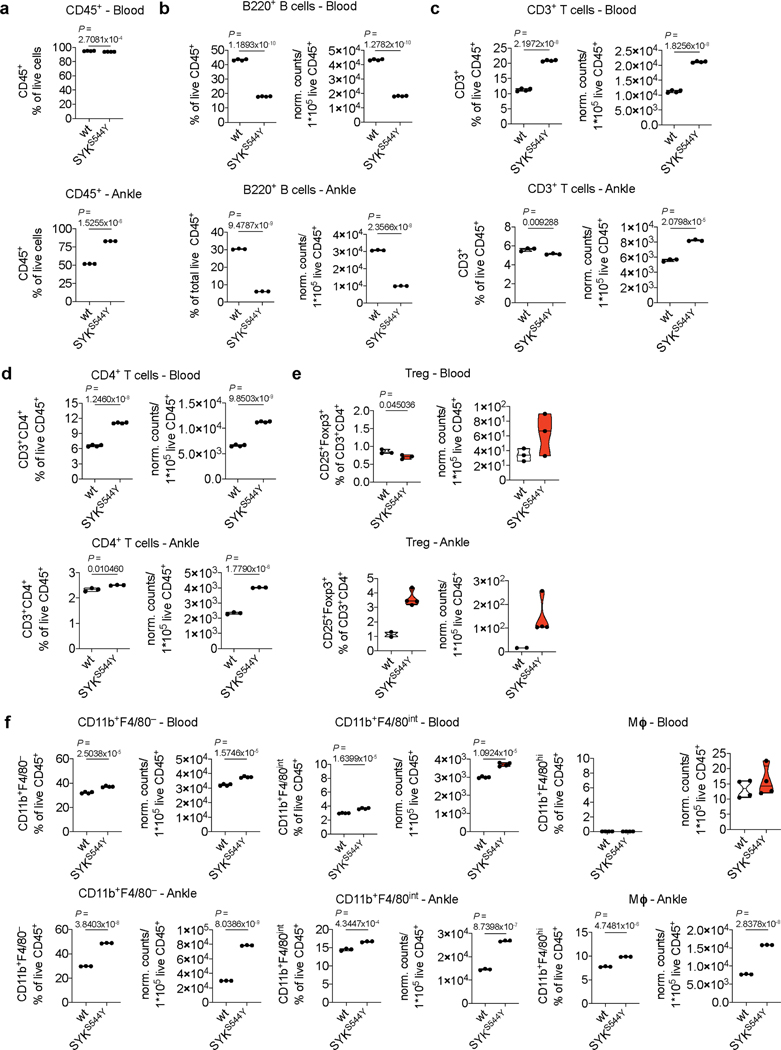
Extended Data Fig. 9. Phenotype of immune cells in circulation and tissue of a CRISPR-Cas9-knock-in SYKS544Y mouse model.
(a) Frequencies of live CD45+ cells in blood (top) and ankles (bottom) of wild-type and SYKS544Y mice (blood: n=4, ankle: n=3; unpaired t-test) at the age of 3 months. (b-f) Frequencies and normalised counts of B220+ B cells, CD3+ T cells, CD4+ T cells, Foxp3+CD25+ regulatory T cells (Treg), CD11b+F4/80– mononuclear phagocytes, CD11b+F4/80int mononuclear phagocytes and CD11b+F4/80+ macrophages (Mɸ) in blood (top) and ankles (bottom) of wild-type and SYKS544Y mice at the age of 3 months (blood: n=4, ankle: n=3; Treg-blood: n=3, Treg-ankle (wt): n=2, Treg-ankle (SYKS544Y): n=4; unpaired t-test). Normalised counts were calculated as counts/1*105 live CD45+ cells relative to the average change in live CD45+ cells comparing wild-type and SYKS544Y mice. Violin plots indicate quartiles and median.

