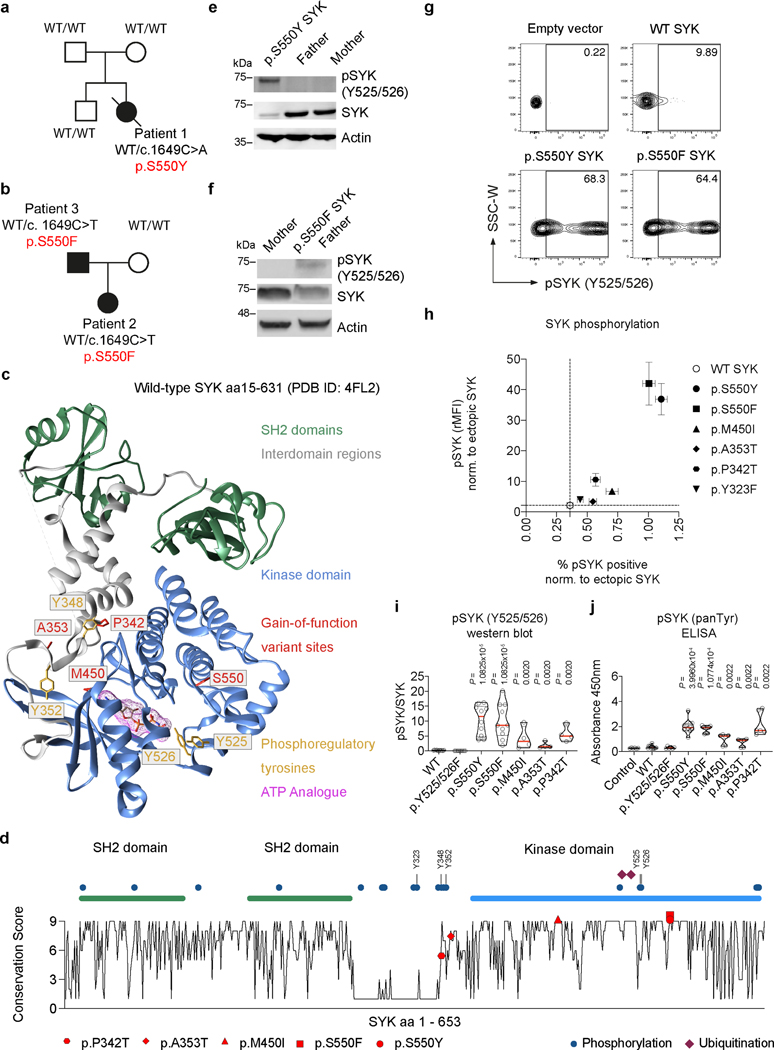
Figure 2. Functional characterization of SYK variants.
(a and b) Pedigree and SYK variant in Patients 1 to 3. (c) Structural model of wild-type human SYK (PDB ID: 4FL2), highlighting the sites of SYK gain-of-function variants (p.P342T, p.A353T, p.M450I, p.S550F and p.S550Y), the ATP binding pocket (occupied by an ATP analogue), and key phosphoregulatory tyrosine residues that determine SYK activity. (d) Graphical illustration of SYK sequence conservation (black line) based on ConSurf conservation score (see Methods). Domain structure, phosphorylation sites (blue dots), ubiquitination sites (dark red squares) and positions of identified patient variants (coloured triangles) are indicated. (e and f) Total and phosphorylated SYK expression in PBMC from family 1 and 2 by western blot (representative blots are shown of 3 independent repeats). (g) Contour plot presentation of pSYK (Y525/526) expression in HEK293 cells transfected with an empty vector, wild-type SYK or mutated p.S550Y or p.S550F SYK assessed by intracellular staining and flow cytometry. (h) SYK phosphorylation in wild-type SYK or mutated SYK assessed by intracellular staining and flow cytometry. Data are shown as normalised relative mean fluorescence intensity (rMFI) of pSYK (Y525/526) to ectopically expressed SYK (y-axis) and normalised % of pSYK positive cells (x-axis) to ectopically expressed SYK; (mean±SD; n of independent experiments/n of cell culture replicates: eV(8/30), WT(8/24), p.S550Y(8/28), p.S550F(6/21), p.M450I(8/28), p.A353T(8/30), p.P342T(8/30), p.Y323F(3/12)). (i) Quantification of western blot analysis of total and phosphorylated levels of SYK (Y525/526) in HEK293 cells according to Extended Data Fig. 4g. (j) SYK phosphorylation (panTyr) in HEK293 cells expressing an empty vector (Control), wild-type SYK (WT) or the diverse range of SYK variants identified in patients as measured by ELISA. i and j: quartiles and median; n of independent experiments: WT(10), p.Y525/526F(10) p.S550Y(10), p.S550F(10), p.M450I(4), p.A353T(4), p.P342T(4). Mann-Whitney test.

