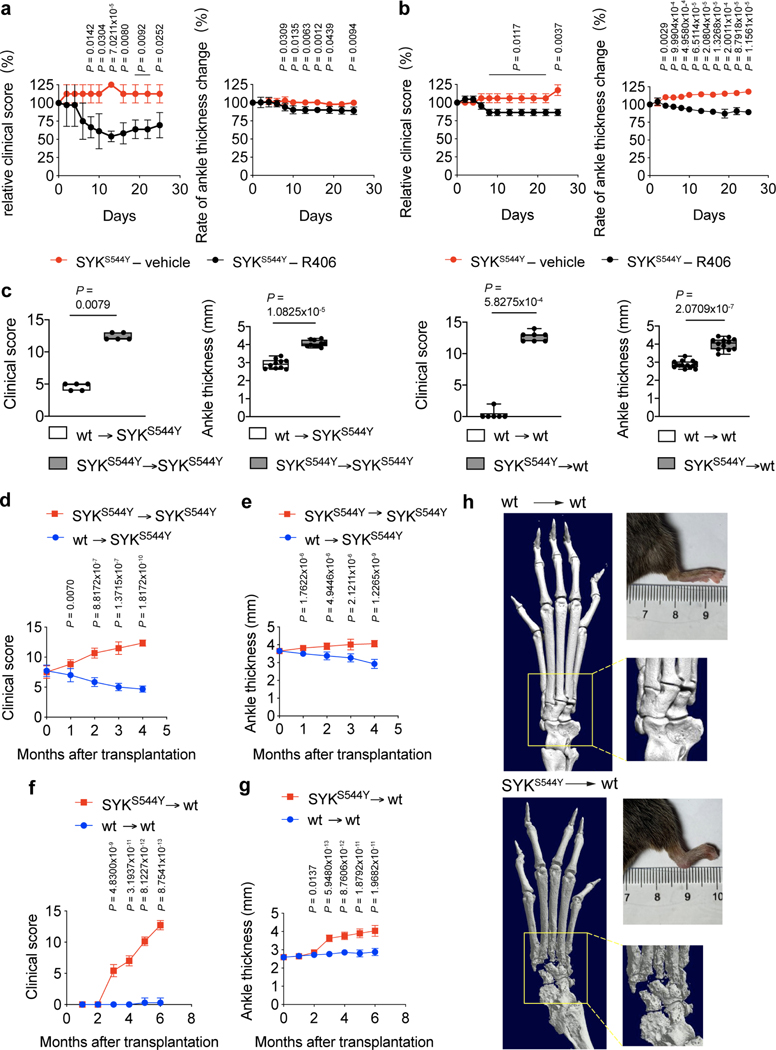
Figure 4. Treatment and bone marrow transplant experiments in SYKS544Y mice.
(a and b) Relative change of clinical score (left) and ankle thickness (right) of SYK inhibitor-treated (R406) (a) 1-month-old mice (n=3) and (b) 3-months-old mice (n=3). Unpaired t-test. (c) Change of clinical score and ankle thickness in 10-weeks-old irradiated (7.5 Gy) wild-type or SYKS544 mice transplanted with SYKS544 bone marrow or wild-type (age=4 months) bone marrow. Numbers of mice from left to right: n=5; n=10; n=6; n=12. Mann-Whitney test. (d and e) Change of (d) clinical score (n=6) and (e) ankle thickness (n=10) in 10-weeks-old irradiated (7.5 Gy) SYKS544 mice transplanted with SYKS544 bone marrow or wild-type (age=4 months) bone marrow over time. (f and g) Change of (f) clinical score (n=7) and (g) ankle thickness (n=12) in 10-weeks-old irradiated (7.5 Gy) wild-type mice transplanted with wild-type or SYKS544 bone marrow (age = 4 months). Unpaired t-test. (h) Micro-CT image of the ankle joints of wild-type (left) and SYKS544Y (right) mice 6 months after bone marrow transplantation (boxed areas show higher digital magnifications), and photographs of the hind limb of wild-type (left panel upper right) and SYKS544Y (right panel upper right) mice 6 months after bone marrow transplantation. Line plots indicate mean±SD. Box and whiskers plots indicate median and interquartile range and minimum to maximum range.

