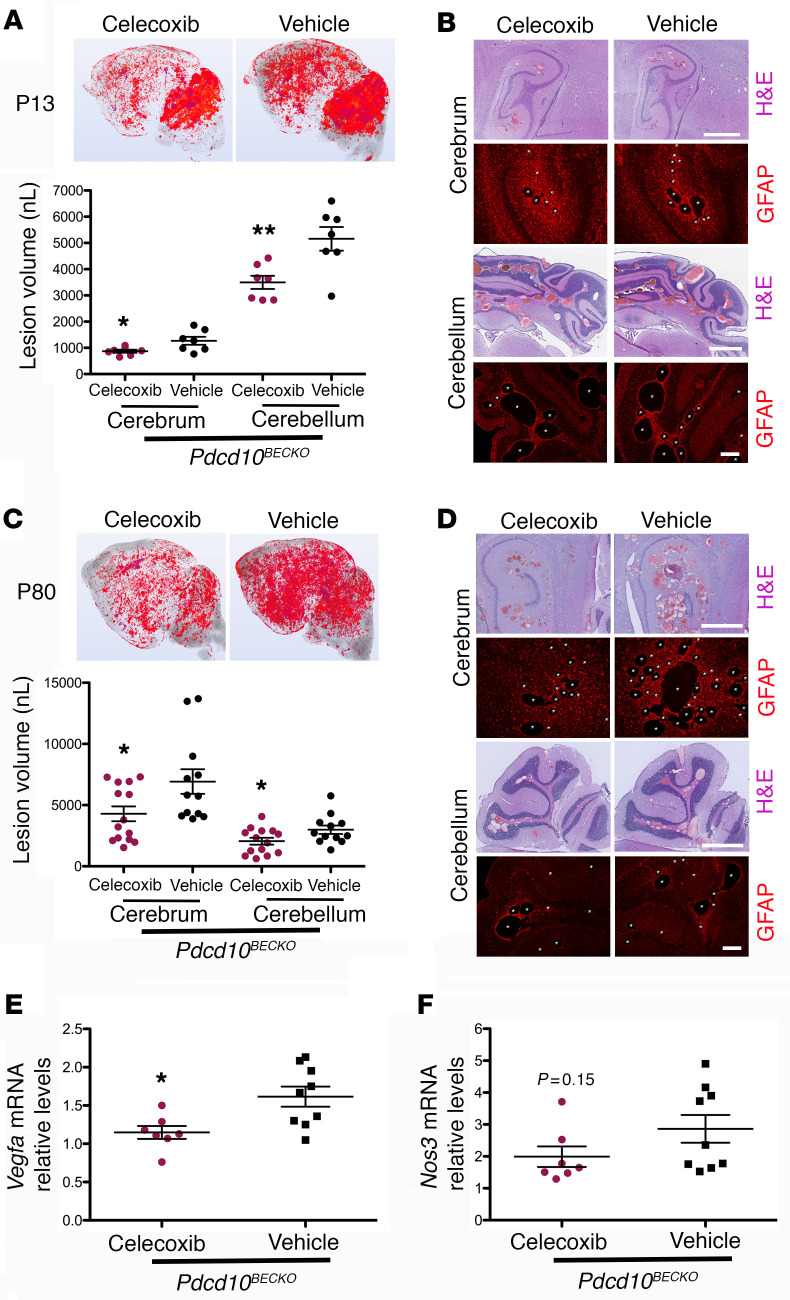
Figure 5. COX-2 inhibition prevents CCM lesions in Pdcd10BECKO mice.
(A) Prominent lesions are present in the cerebellum and cerebrum of P13 Pdcd10BECKO mice. Intragastric administration of 40 mg/kg celecoxib for 4 consecutive days at P6 to P9 suppressed lesion formation. Quantification of lesion volumes by micro-CT analysis from mice at P13 treated with celecoxib or vehicle (SEM, n = 7 mice in each group). (B) Hematoxylin and eosin (pink and purple) or GFAP (red) staining of cerebral (hippocampal area) and cerebellar sections from Pdcd10BECKO mice after treatment with celecoxib or vehicle (n = 3). (C) Prominent lesions are present in the cerebellum and cerebrum of P80 Pdcd10BECKO mice. Oral gavage administration of 40 mg/kg celecoxib for 15 consecutive days at P55 to P70 suppressed lesion formation. Quantification of lesion volumes by micro-CT analysis from mice at P80 treated with celecoxib or vehicle (SEM, n = 12 or 14 mice in each group). (D) Hematoxylin and eosin (pink and purple) or GFAP (red) staining of cerebral (hippocampal area) and cerebellar sections from Pdcd10BECKO mice after treatment with celecoxib or vehicle (n = 3). (E and F) Quantification of Vegfa (E) or Nos3 (F) mRNA levels in P80 Pdcd10BECKO spinal cords after treatment with celecoxib or vehicle from experiments in (C) (SEM, n = 7 or 9 mice in each group). Data are mean ± SEM. *P < 0.05, **P < 0.01, as determined by Student’s t test. Scale bars: 1 mm (H&E), 200 μm (GFAP) (B and D).

