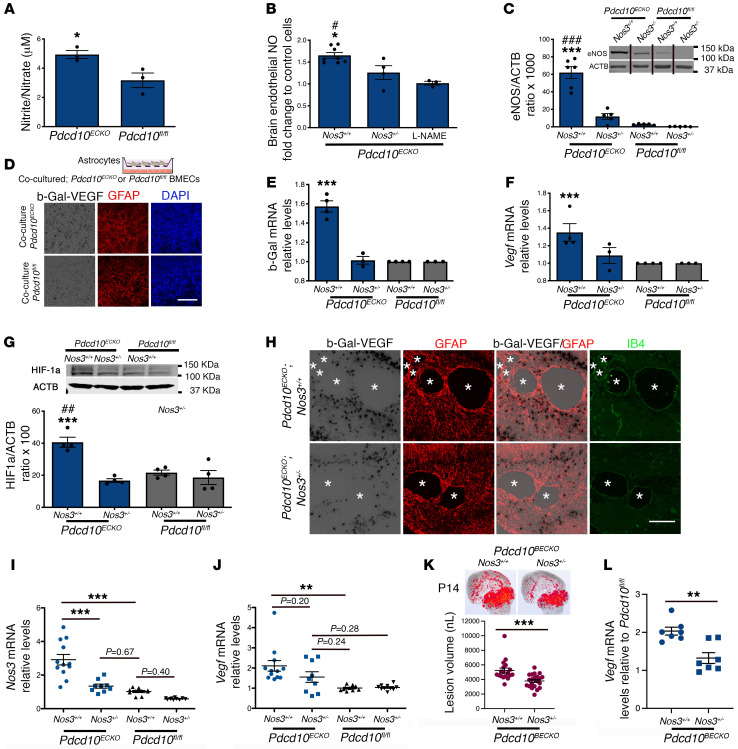
Figure 8. Loss of brain endothelial Pdcd10 increases NO production and induces astrocyte-derived VEGF.
(A) Total NO production from the media of Pdcd10ECKO and Pdcd10fl/fl BMECs cultured for 36 hours (SEM, n = 7). (B) NO release in Pdcd10ECKO and Pdcd10ECKO Nos3+/– BMECs or following incubation with L-NAME (150 μM) (SEM, n = 3). (C) Quantification of eNOS protein from Pdcd10ECKO and Pdcd10ECKO Nos3+/– BMECs (SEM, n = 5). Culture media was supplemented with 500 uM l-arginine and was deficient in serum. Lanes in this panel were run on the same gel but were noncontiguous. (D) β-gal/VEGF expression (black) and staining for GFAP (red) of primary cultured astrocytes cocultured with Pdcd10ECKO BMECs compared with Pdcd10fl/fl BMEC controls for 48 hours (n = 2). (E) RT-qPCR analysis of β-gal and (F) Vegfa mRNA in primary cultured astrocytes cocultured with Pdcd10ECKO BMEC compared with Pdcd10fl/fl BMEC controls (SEM, n = 4). (G) Quantification of HIF-1α protein from primary astrocytes cocultured with Pdcd10ECKO BMEC and Pdcd10ECKO Nos3+/– BMECs (SEM, n = 4). (H) Neonatal hindbrain at P10 from Pdcd10ECKO Nos3+/+ Vegfatm1.1Nagy (Pdcd10ECKO eNOS+/+) and Pdcd10fl/fl Nos3+/– Vegfatm1.1Nagy (Pdcd10ECKO eNOS+/–) littermate controls stained for GFAP-positive astrocytes (red), β-gal/VEGF (black), isolectin B4 (green). Asterisks indicate vascular lumen of CCM lesions (n = 3). (I and J) Quantification of Nos3 (I) and Vegf (J) mRNA levels in P10 Pdcd10ECKO Nos3+/– and Pdcd10ECKO and Pdcd10fl/fl Nos3+/– hindbrains when compared with littermate Pdcd10fl/fl controls, as assessed by RT-qPCR (SEM, n = 9 or 12 mice in each group). (K) Micro-CT analysis from mice at P14 Pdcd10BECKO Nos3+/+ and Pdcd10BECKO Nos3+/– mice (SEM, n =18 or 21 mice in each group). (L) Vegf mRNA levels in P14 Pdcd10BECKO Nos3+/– and Pdcd10BECKO Nos3+/+ cerebral tissue (SEM, n = 7 mice in each group, except for Pdcd10fl/fl Nos3+/+ n = 2). Data are mean ± SEM. *, #P < 0.05, ##P < 0.01, ***, ###P < 0.001 (*comparison to Pdcd10ECKO Nos3+/– and #comparison to L-NAME or Pdcd10fl/fl eNOs+/+), as determined by Student’s t test and 1-way ANOVA, followed by the Tukey post hoc test. Scale bars: 100 μm (D and H).

