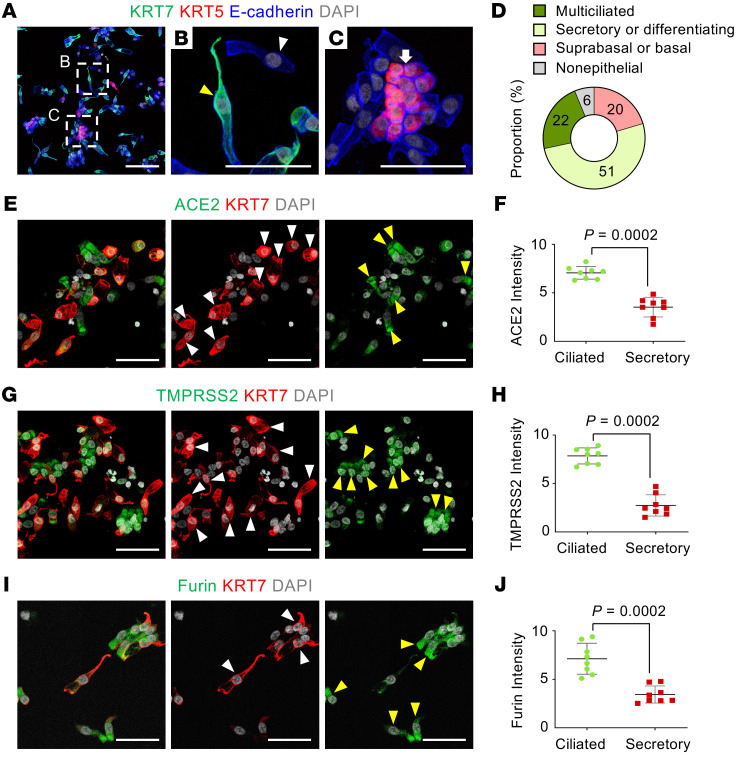
Figure 3. SARS-CoV-2 entry molecule proteins are highly present in fully differentiated multiciliated cells, but not in secretory or differentiating cells.
(A–C) Representative images showing subtypes of human nasal epithelial cells. White-dashed boxes in A are magnified in B and C. Scale bar in A: 100 μm. (B) Image showing KRT7hi secretory- or differentiating-type cells (yellow arrowhead) and KRT5lo/KRT7lo fully differentiated multiciliated cells (white arrowhead). Scale bar: 50 μm. (C) Image showing KRT5hi basal type cells (white arrow). Scale bar: 50 μm. (D) Donut plot showing subtype proportions in 1538 pooled smeared nasal epithelial cells of healthy volunteers (n = 3). (E–J) Representative images and comparisons of relative ACE2, TMPRSS2, and FURIN intensity in the smeared nasal cells, showing high in KRT7lo fully differentiated multiciliated cells (yellow arrowheads) but very low in KRT7hi secretory or differentiating cells (white arrowheads). Scale bars: 50 μm. (F, H, and J) Each dot indicates a value obtained from 1 smear sample in 3 volunteers (3 smeared slides per volunteer) from 2 independent experiments. Horizontal bars indicate the mean ± SD. P value versus ciliated cells was obtained by 2-tailed Mann-Whitney U test.

