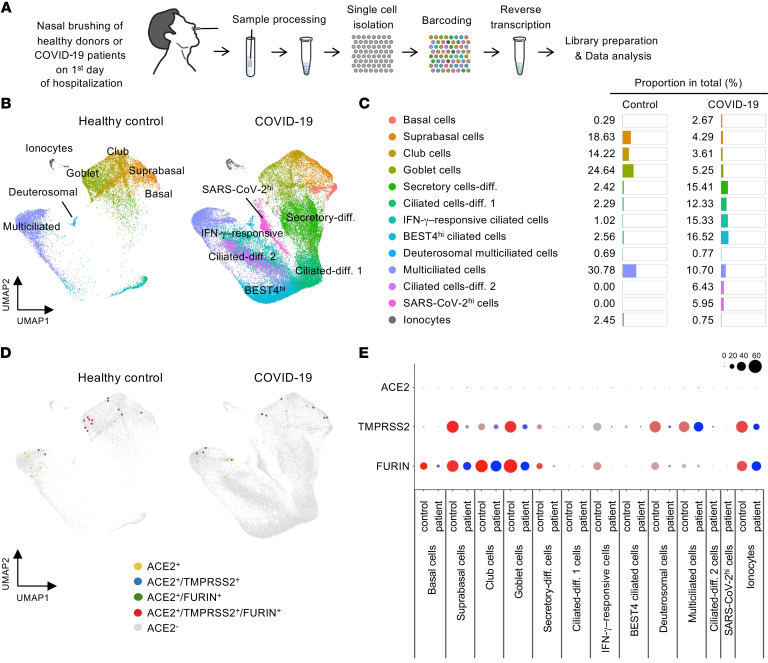
Figure 4. Comparison of cellular composition and SARS-CoV-2 entry molecular gene expression in nasal epithelial cells between healthy donors and patients with COVID-19.
(A) Schematic diagram depicting a series of procedures for scRNA-Seq of nasal epithelial cells from COVID-19 patients. (B) UMAP plot comparing unsupervised clustering of nasal epithelial cell subsets between healthy controls and patients with COVID-19. (C) List and proportion plots comparing proportion of each epithelial cell subset in total clustered epithelial cells between healthy controls and COVID-19 patients. (D) Unsupervised clustering projected on a 2D UMAP plot comparing distributions of ACE2+, ACE2+/TMPRSS2+, ACE2+/FURIN+, and ACE2+/TMPRSS2+/FURIN+ cells across total pooled nasal epithelial cells between healthy controls and COVID-19 patients. (E) Dot plot heatmap comparing expressions of SARS-CoV-2 entry molecule genes per each cell cluster between healthy controls and COVID-19 patients.

