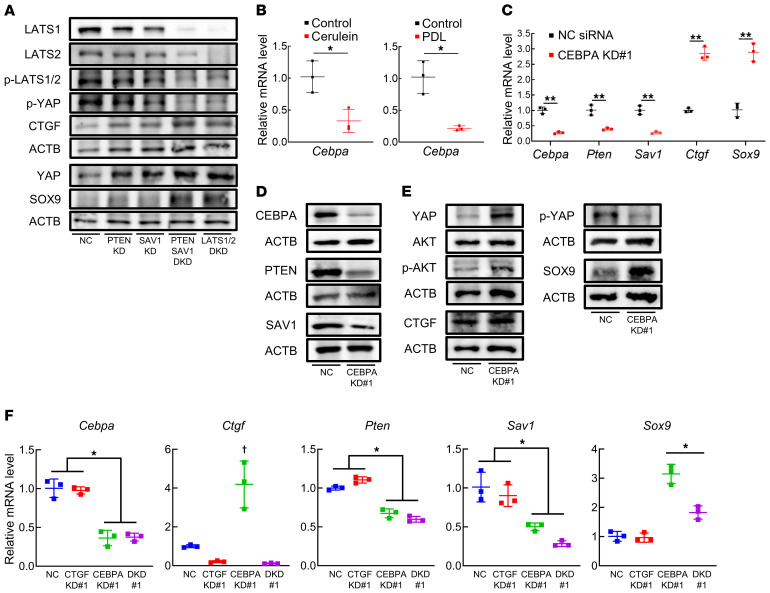
Figure 3. CEBPA positively regulates PTEN and SAV1 in acinar cells, and inhibition of PTEN and SAV1 induces ADM through CTGF upregulation in vitro.
(A) Protein levels of LATS1, LATS2, p-LATS1/2, YAP, p-YAP, CTGF, SOX9, and ACTB in 266-6 cells 3 days after transfection with negative control (NC) siRNA, Pten siRNA (PTEN knockdown [KD]), Sav1 siRNA (SAV1 KD), both Pten and Sav1 siRNAs (PTEN SAV1 double KD [DKD]), or both Lats1 and Lats2 siRNAs (LATS1/2 DKD). (B) Cebpa mRNA levels in pancreatic tissue in mice after repeated cerulein or vehicle (control) injections (left) and in mice subjected to PDL surgery or sham surgery (right). (C and D) mRNA levels of Cebpa, Pten, Sav1, Ctgf, and Sox9 (C) and protein levels of CEBPA, PTEN, SAV1, and ACTB (D) in 266-6 cells 3 days after transfection with NC siRNA or Cebpa siRNA (#1) (CEBPA KD#1). (E) Protein levels of YAP, p-YAP, AKT, p-AKT, CTGF, SOX9, and ACTB in 266-6 cells 3 days after transfection with NC siRNA or Cebpa siRNA (#1) (CEBPA KD#1). (F) mRNA levels of Cebpa, Ctgf, Pten, Sav1, and Sox9 in 266-6 cells 3 days after transfection with NC siRNA, Ctgf siRNA (#1) (CTGF KD#1), Cebpa siRNA (#1) (CEBPA KD#1), or both Cebpa (#1) and Ctgf siRNAs (#1) (DKD#1). Blots run in parallel contemporaneously or run at different times with loading control for each gel are shown. The data are presented as the means ± SDs of results for 3 samples per group. Student’s t test was used to evaluate differences between 2 groups (B and C). One-way ANOVA with Tukey’s post hoc test was used to compare differences among 4 groups (F). *P < 0.05, **P < 0.005, and †P < 0.05 vs. all groups.

