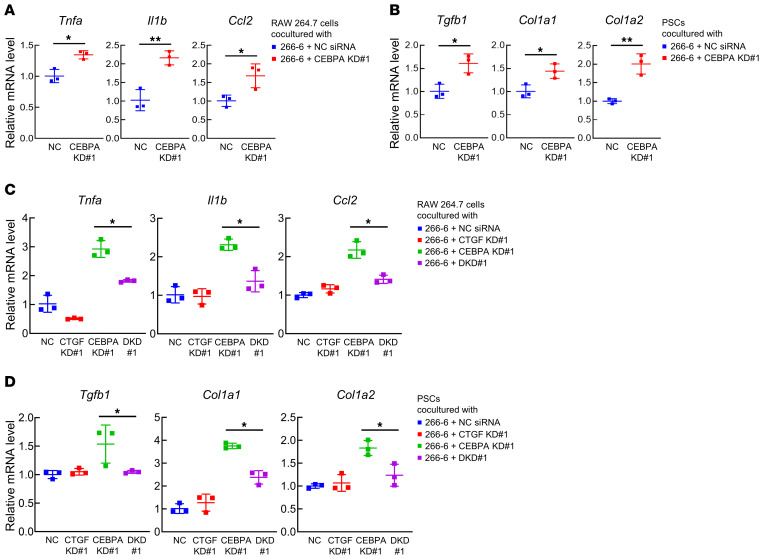
Figure 4. Inhibition of PTEN and SAV1 in PACs may activate surrounding macrophages and PSCs via CTGF upregulation in vitro.
(A) mRNA levels of Tnfa, Il1b, and Ccl2 in RAW 264.7 cells 2 days after coculture with 266-6 cells transfected with negative control (NC) siRNA or Cebpa siRNA (#1) (CEBPA knockdown [KD] #1). (B) mRNA levels of Tgfb1, Col1a1, and Col1a2 in PSCs isolated from mouse pancreata 2 days after coculture with 266-6 cells transfected with NC siRNA or Cebpa siRNA (#1) (CEBPA KD#1). (C) mRNA levels of Tnfa, Il1b, and Ccl2 in RAW 264.7 cells 2 days after coculture with 266-6 cells transfected with NC siRNA, Ctgf siRNA (#1) (CTGF KD#1), Cebpa siRNA (#1) (CEBPA KD#1), or both Cebpa (#1) and Ctgf (#1) siRNAs (double KD [DKD] #1). (D) mRNA levels of Tgfb1, Col1a1, and Col1a2 in PSCs isolated from mouse pancreata 2 days after coculture with 266-6 cells transfected with NC siRNA, Ctgf siRNA (#1) (CTGF KD#1), Cebpa siRNA (#1) (CEBPA KD#1), or both Cebpa (#1) and Ctgf (#1) siRNAs (DKD#1). All data are presented as the means ± SDs of results for 3 samples per group. Student’s t test was used to evaluate differences between 2 groups (A and B). One-way ANOVA with Tukey’s post hoc test was used to compare differences among 4 groups (C and D). *P < 0.05 and **P < 0.005.

