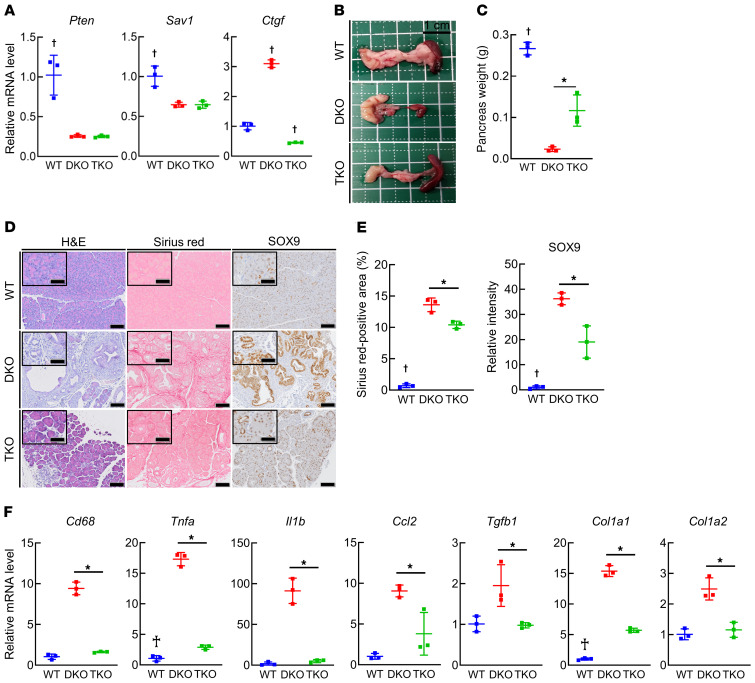
Figure 5. CTGF produced by PACs is involved in the development of CP via pancreas-specific Pten and Sav1 loss in vivo.
Pancreatic phenotypes were examined in WT mice, mice with pancreas-specific Pten and Sav1 double knockout (DKO), and mice with Pten, Sav1, and Ctgf triple knockout (TKO) at 6 weeks of age. (A) Pten, Sav1, and Ctgf mRNA levels in pancreatic tissue. (B) Macroscopic images of the pancreas. (C) Pancreas weight. (D and E) Representative images of H&E, Sirius red, and SOX9 staining of pancreatic tissue (D) and quantification of the Sirius red–positive area (E, left) and SOX9 staining intensity (E, right). (F) Cd68, Tnfa, Il1b, Ccl2, Tgfb1, Col1a1, and Col1a2 mRNA levels in pancreatic tissue. All data are presented as the means ± SDs of results for 3 mice per group. One-way ANOVA with Tukey’s post hoc test was used to compare differences among 3 groups. *P < 0.05 and †P < 0.05 vs. all groups. Scale bars: 100 μm and 50 μm (insets).

