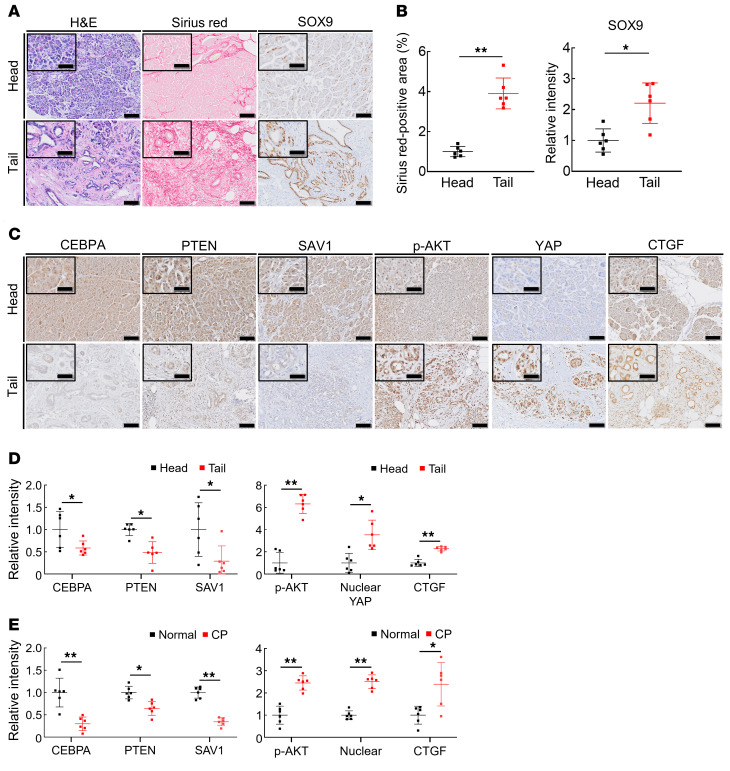
Figure 7. CP tissues exhibit lower PTEN and SAV1 levels and higher CTGF levels than nonpancreatitis tissues from humans.
(A and B) Representative images of H&E, Sirius red, and SOX9 staining of pancreatic tissue from the head or tail side of PDAC tumors from pancreatic cancer patients (A) and quantification of the Sirius red–positive area (B, left) and SOX9 staining intensity (B, right). (C and D) Representative images of CEBPA, PTEN, SAV1, p-AKT, nuclear YAP, and CTGF staining of pancreatic tissue from the head or tail side of PDAC tumors from pancreatic cancer patients (C) and the relative staining intensity of CEBPA, PTEN, SAV1, p-AKT, nuclear YAP, and CTGF (D). (E) The relative intensity of CEBPA, PTEN, SAV1, p-AKT, nuclear YAP, and CTGF staining of pancreatic tissue from the normal pancreatic regions obtained from pancreatic neuroendocrine tumor patients or from the chronic pancreatic regions obtained from CP patients. All data are presented as the means ± SDs of results for 6 samples per group. Student’s t test was used to evaluate differences between 2 groups. *P < 0.05 and **P < 0.005. Scale bars: 100 μm and 50 μm (insets).

