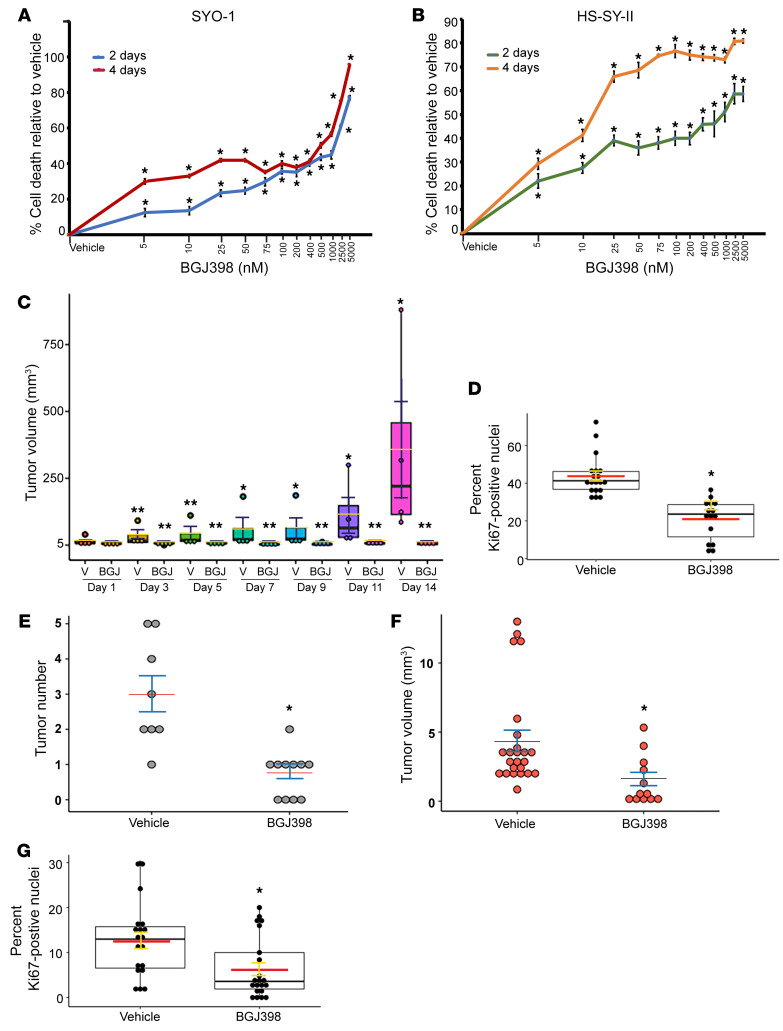
Figure 2. In vitro and in vivo effects of BGJ398 in SS cells and tumors.
(A and B) Dose-response curves show effects of 2-day and 4-day BGJ398 treatments on SYO-1 (A) and HS-SY-II (B) cells relative to vehicle. Each point represents the average of 12 values derived from 2 independent experiments, each conducted in 6 replicates. Error bars indicate SEM. P values (*P ≤ 0.00079 in the SYO-1 curves; *P ≤ 0.00191 in the HS-SY-II curves) compare mean growth of BGJ398- and vehicle-treated cells at each point. (C) Box plot shows growth of BGJ398-treated and vehicle-treated (V) SYO-1 tumors. Dots represent individual tumors. Crossbars indicate average volumes. Error bars indicate SEM. P values compare mean volumes on days 3–14 after treatment with mean volume on day 1. *P ≤ 0.0138; **P ≥ 0.064. (D) Box plot shows percentage of Ki67-positive cells in BGJ398-treated tumors and vehicle-treated tumors. Overlaid dots represent individual fields counted in 4 tumors from each group; vehicle: 19 fields (2925 cells); BGJ398: 15 fields (1670 cells). Red crossbars indicate average percentages, and error bars indicate SEM. *P = 0.000194 was calculated by comparison of mean values of the 2 groups. (E) Dot plot shows tumor number per mouse in vehicle- and BGJ398-treated SM2 mice. (F) Plot shows individual tumor volumes in vehicle- and BGJ398-treated SM2 mice. Crossbars indicate average, and error bars indicate SEM. *P = 0.000937 (E) and *P = 0.0018 (F) compare means between the vehicle and BGJ398 groups. (G) Box plot shows percentage of Ki67-positive cells in BGJ398-treated and vehicle-treated SM2 tumors. Dots represent individual fields counted in 4 tumors from each group; vehicle: 19 fields (3527 cells); BGJ398: 21 fields (3244 cells). Crossbars indicate average percentages, and error bars indicate SEM. *P = 0.00341 compares means of both groups.

