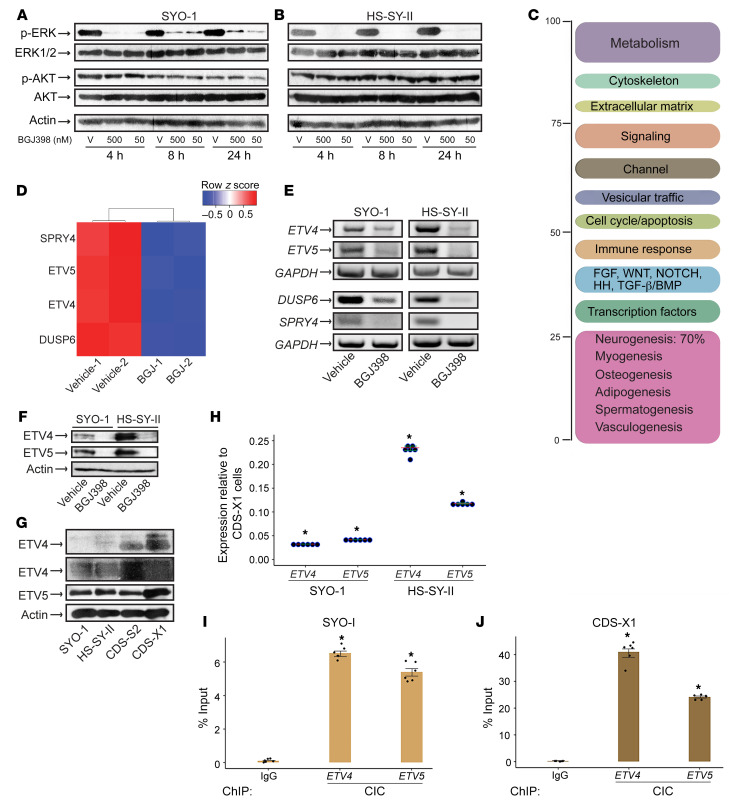
Figure 3. BGJ398 inhibits ETV4 and ETV5 expression in SS cells.
(A and B) Immunoblots show the effect of 50 nM and 500 nM BGJ398 on phospho-ERK1/2 and phospho-AKT levels in SYO-1 (A) and HS-SY-II (B) cells at the indicated times. V, vehicle (DMSO). n = 2. (C) Functional categorization of the SYO-1 transcriptome following a 24-hour BGJ398 treatment. (D) Heatmap illustrates the downregulation of FGFR pathway–related targets by BGJ398 in SYO-1 cells; -1 and -2 represent duplicate samples. (E) RT-PCR of the indicated genes in SYO-1 (left panel) and HS-SY-II (right panel) cells treated with BGJ398 or vehicle. GAPDH served as input control. The PCR primers are described in Methods. (F) Immunoblot shows ETV4 and ETV5 levels in SYO-1 and HS-SY-II cells treated with BGJ398 or vehicle. Actin served as loading control. n = 2. (G) Immunoblots show ETV4 and ETV5 expression in 50 μg of SYO-1, HS-SY-II, CDS-S2, and CDS-X1 lysates. Two exposures of the ETV4 immunoblot are included. (H) Dot plot shows ETV4 and ETV5 mRNA levels in SS (SYO-1, HS-SY-II) relative to CDS-X1 cells. Dots represent independent values normalized against GAPDH and plotted as fold change. Data are derived from 2 RT-qPCR experiments performed in triplicate. Crossbars indicate the mean. Error bars indicate SEM. P values (*P < 0.00001) compare ΔCt averages in CDS-X1, SYO-1, and HS-SY-II cells. (I and J) Bar graphs show CIC binding to ETV4 and ETV5 promoters in SYO-1 (I) and CDS-X1 (J) cells. Dots represent independent values from 2 ChIP-qPCR experiments each conducted in triplicate. IgG served as background control. IgG binding and CIC binding were quantified as percentage of input chromatin. Error bars indicate SEM. P values (*P ≤ 0.0003 in SYO-1; *P < 0.00001 in CDS-X1) compare ΔCt averages of CIC antibody versus IgG.

