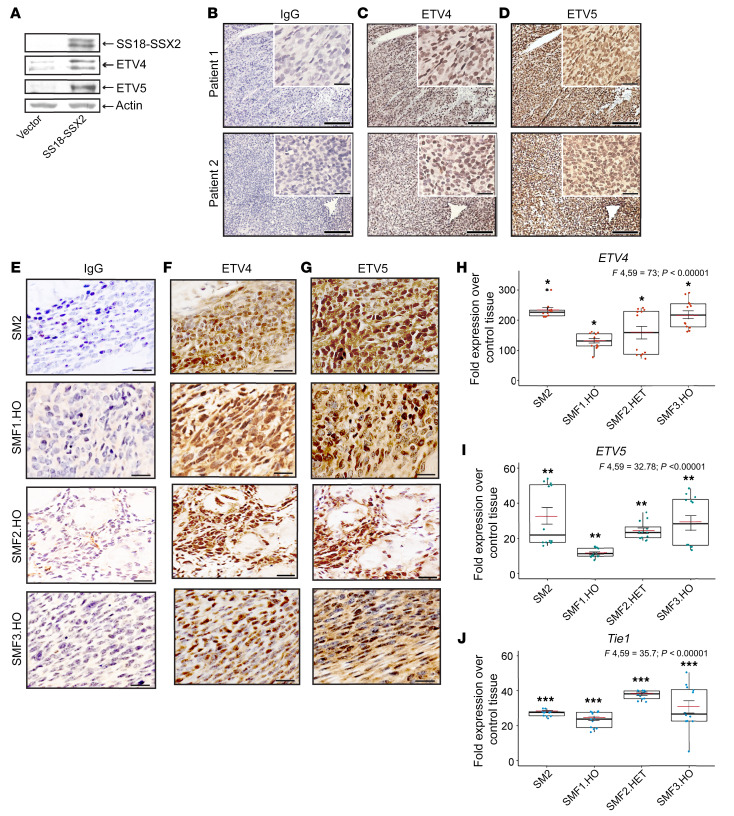
Figure 5. ETV4 and ETV5 expression in SS tumors.
(A) Immunoblot shows ETV4 and ETV5 levels in SS18-SSX2–expressing C2C12 myoblasts. Vector is backbone control vector (POZ; see Supplemental Methods). SS18-SSX2 was visualized with anti-FLAG antibody. Actin served as loading control. (B–D) ETV4 and ETV5 IHC staining in tumors resected from two SS patients. Scale bars on the inset images: 50 μm; all other scale bars: 500 μm. (E–G) Representative images of ETV4 and ETV5 expression in tumors derived from SM2, SMF1.HO, SMF2.HO, and SMF3.HO mice. Scale bars: 20 μm. (H–J) Box plots show fold expression of ETV4 (H), ETV5 (I), and Tle1 (J) in the indicated tumor models over tissue derived from control mice. Two mice in each group were used for RNA isolation. The 12 overlaid dots in each box indicate individual values normalized against Gapdh and plotted as fold change over control. Data are derived from 2 RT-qPCR experiments performed in 6 replicates. Red crossbars indicate the mean. Error bars indicate SEM. P values compare average expression in each model against average expression in control tissues. *P < 0.00001; **P ≤ 0.00065; ***P ≤ 0.0019. ANOVA F ratios and corresponding P values shown on top demonstrate significant variation of means among the 4 groups in each plot.

