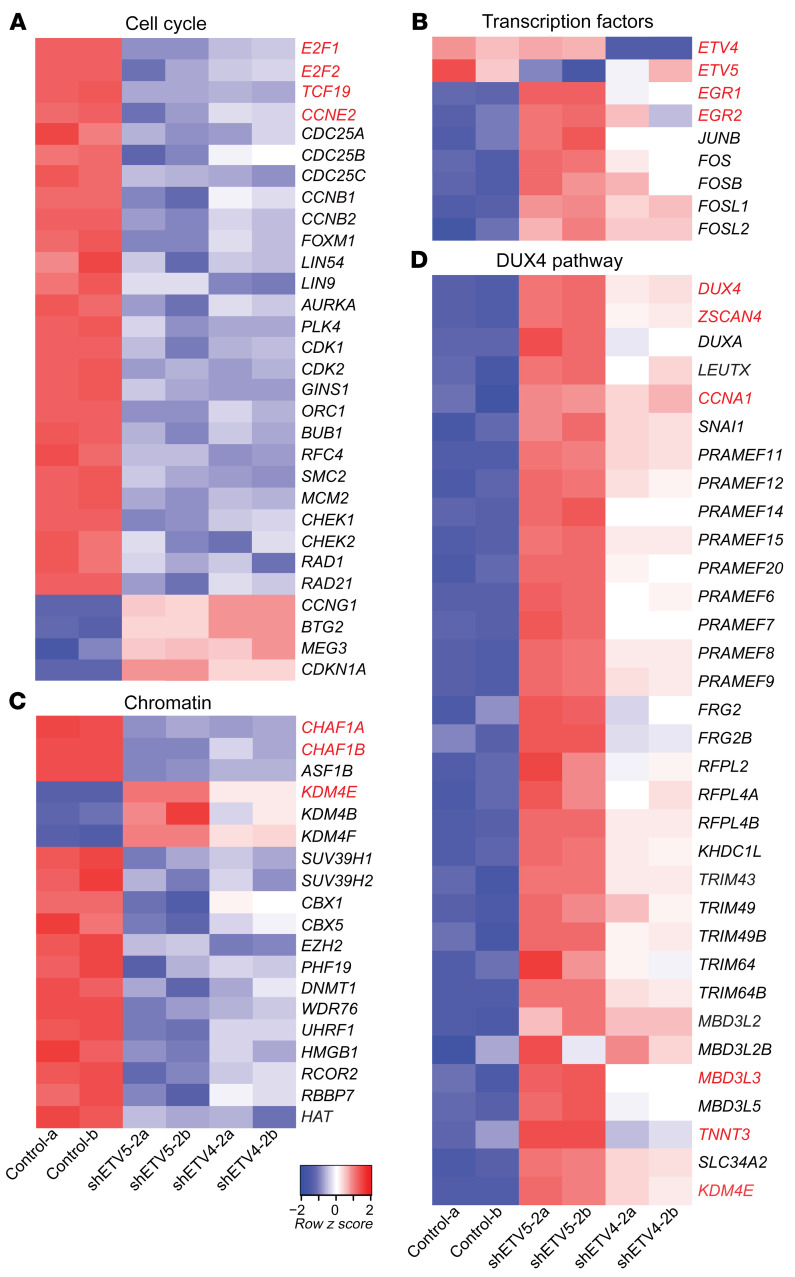
Figure 7. Analysis of the SS cell transcriptome upon ETV4 and ETV5 knockdown.
Heatmaps of differentially expressed genes in SYO-1 cells expressing control, shETV4-2, and shETV5-2 vectors. Lanes a and b represent duplicate RNA samples. A selection of genes belonging to the cell cycle (A), transcription factors (B), chromatin (C), and DUX4 pathways (D) is shown.

