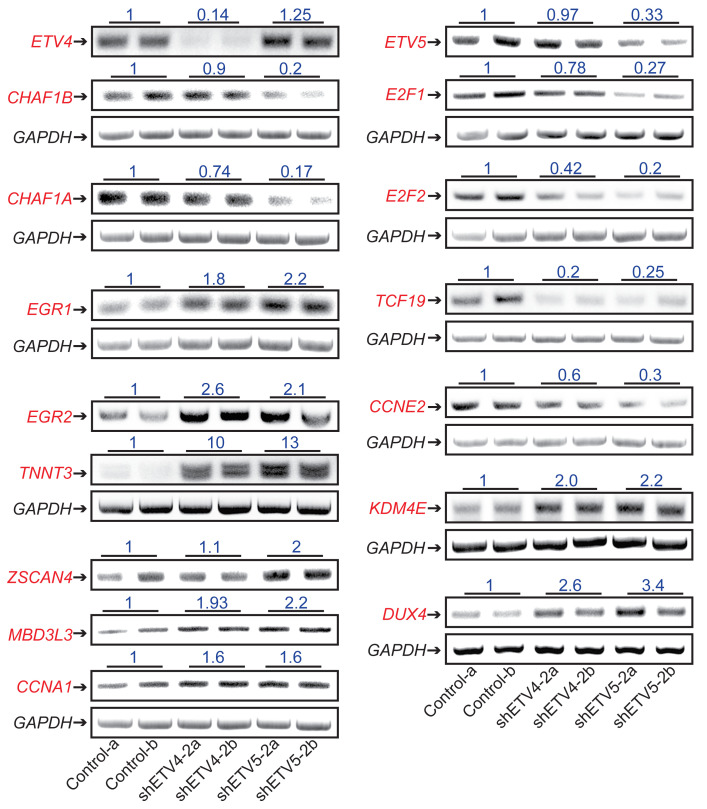
Figure 8. Validation of the SS cell transcriptome upon ETV4 and ETV5 knockdown.
RT-PCR of the indicated targets in SYO-1 cells. GAPDH served as input control. RT-PCR was performed on 2 independent RNA samples (a and b) of control, shETV4-2–expressing, and shETV5-2–expressing cells. Numbers represent band intensities relative to control. Band intensities were calibrated with GAPDH; their measurement and the PCR primers used are described in Methods (Statistics) and Supplemental Methods.

