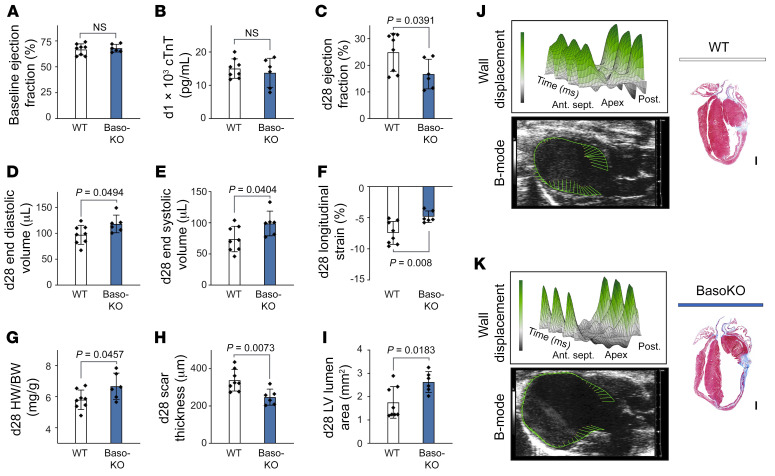
Figure 3. Baso-KO mice show deteriorated healing after MI.
(A) Echocardiographic evaluation of baseline EF in WT and Baso-KO mice. (B) Plasma cTnT values in WT and Baso-KO mice measured 24 hours after LAD ligation. (C–F) Echocardiographic results for Baso-KO and WT mice 4 weeks after MI. P values were determined by 2-tailed Student’s t test. (G) Quantification of heart weight to body weight ratio 4 weeks after MI. P value was determined by 2-tailed Student’s t test. (H and I) Scar thickness and LV lumen area were quantified by histological evaluation 4 weeks after MI (n = 6–8). Data show the mean ± SD. P values were determined by 2-tailed Student’s t test. (J and K) Representative echocardiographic and histological images of WT and Baso-KO mice 4 weeks after MI. 3D plots show radial displacement over 3 cardiac cycles. Histological sections were stained with Masson’s trichrome to detect fibrosis. Scale bars: 500 μm. Ant. sept., anterior septal; Post., posterior.

