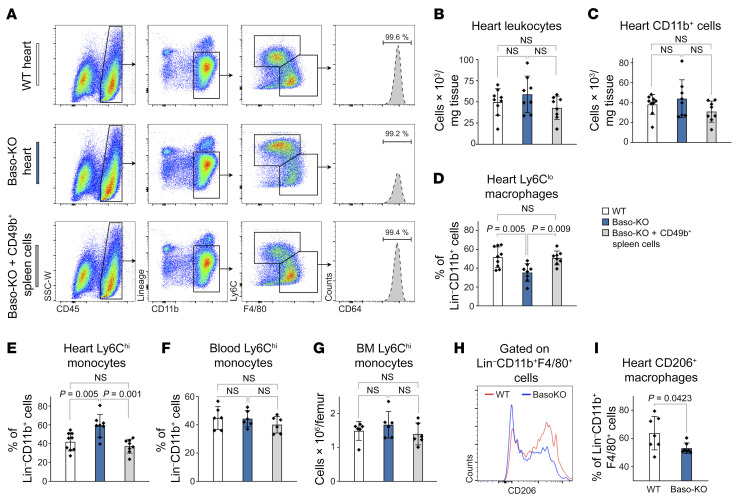
Figure 4. Genetic basophil depletion affects cardiac monocytes and macrophages.
(A) Representative flow cytometric plots of infarct tissue 4 days after MI, following transfer of basophil-enriched cells (bottom) gated on monocytes/macrophages. Heart cells were from WT and Baso-KO mice, and splenic cells were from WT mice. (B and C) Quantification of total numbers of CD45+ cells or CD45+CD11b+ cells per milligram of heart tissue. (D and E) Percentage of heart-infiltrating Ly6Chi monocytes and Ly6CloCD64+ macrophages (among the percentage of total Lin–CD11b+ cells) 4 days after LAD ligation (n = 8–9). Data indicate the mean ± SD. P values were determined by 1-way ANOVA followed by Tukey’s multiple-comparison test. (F and G) Blood and BM monocyte levels for the indicated groups 4 days after MI (n = 6). (H) Representative histogram depicting CD206+ cells among Lin–CD11b+F4/80+ macrophages 4 days after MI. (I) Proportion of CD206+ cells among Lin–CD11b+F4/80+ macrophages in the heart 4 days after MI (n = 7). Data show the mean ± SD. P value was determined by 2-tailed Student’s t test.

