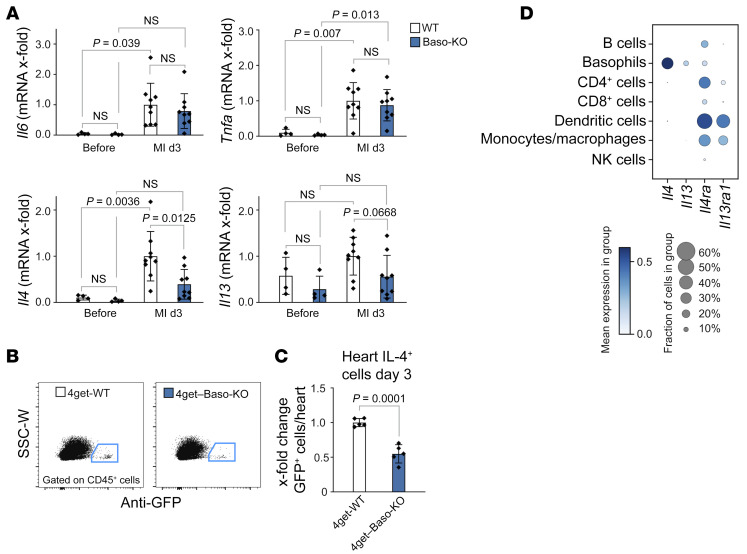
Figure 5. Basophils contribute to IL-4 and IL-13 production in the injured heart after MI.
(A) mRNA expression of Il6, Tnfa, Il4, and Il13 in the infarct region 3 days after MI in WT and Baso-KO mice (n = 8–9). mRNA levels are expressed as x-fold relative to the WT MI group. Data show the mean ± SD. P values were determined by 2-way ANOVA followed by Sidak’s multiple-comparison test. (B) Representative flow cytometric plots of cells from the infarct region 3 days after MI in WT 4get and Baso-KO 4get mice. (C) Quantification of GFP+ cells in the infarct region 3 days after MI in control WT 4get and Baso-KO 4get mice (n = 5). Data show the mean ± SD. P value was determined by 2-tailed Student’s t test. (D) Gene expression dot plot based on single-cell RNA-Seq analysis of mouse cardiac leukocytes 3–7 days after MI. Mean expression is depicted by color intensity, whereas the dot size represents the fraction of cells expressing the indicated gene.

