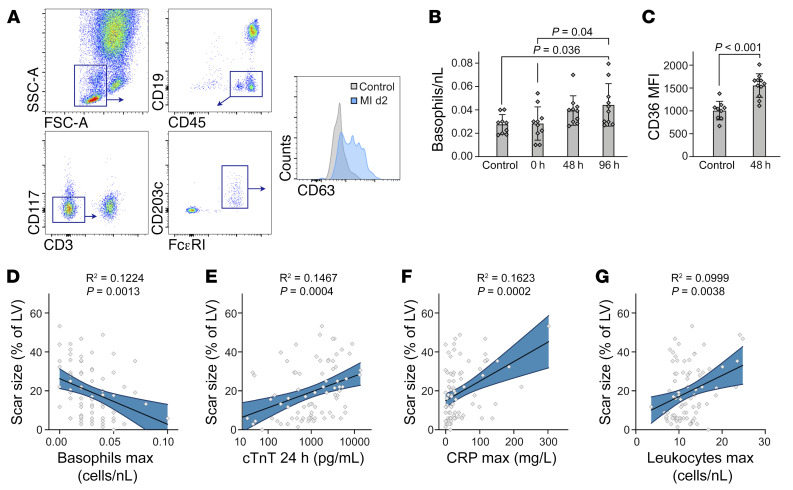
Figure 8. Low basophil counts predict poor remodeling in patients with STEMI.
(A) Gating strategy for the identification of blood basophils in patients with STEMI. (B) Kinetics of blood basophils identified as CD45+CD19–CD3–CD117–FcεRI+CD203c+ in patients with STEMI (n = 11) and control patients (n = 9). P values were determined by 1-way ANOVA with Sidak’s multiple-comparison test. (C) Quantification of CD63 expression on human basophils based on MFI for control and MI patients. Data show the mean ± SD. P value was determined by 2-tailed Student’s t test. (D–G) Linear regression analysis for the association of scar size 12 months after MI and maximum (max) basophil counts during the first week after MI (D), cTnT levels 24 hours after MI (E), peak CRP values (F), and peak leukocyte counts (G) during the first week after MI. Curved blue lines indicate 95% CIs. Each data point (n = 82) represents a biologically independent sample.

