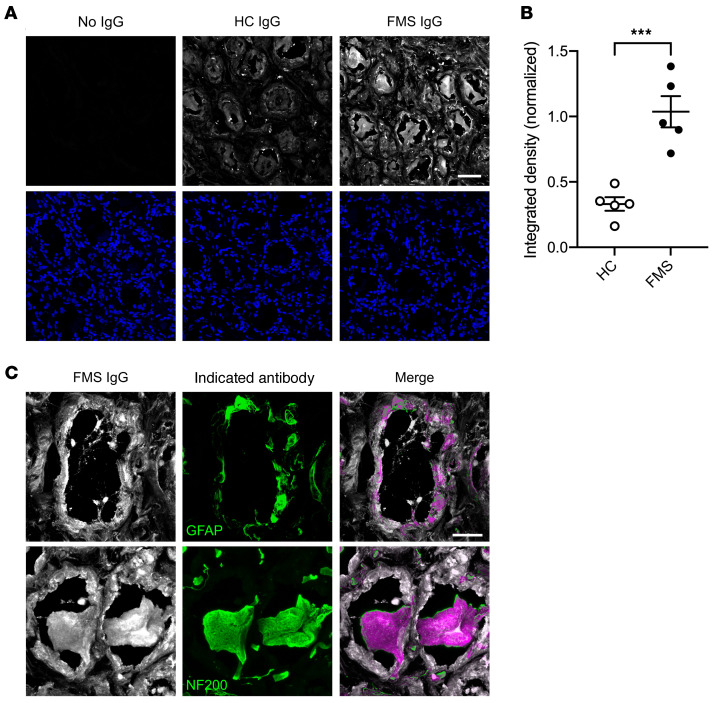
Figure 11. FMS IgG binds human DRG.
FMS IgG bound human DRG tissue sections more intensely than HC IgG when assessed by integrated density normalized to DAPI (A and B). The indicated IgG is in white in the top row and DAPI is in blue in the bottom row of A. High-magnification images of FMS IgG (white) demonstrate colocalization (purple) with GFAP-immunoreactive satellite glial cells (green) and NF-200–immunoreactive neurons (green) (C). Scale bars: 50 μm (A) and 20 μm (C). Data are mean ± SEM (n = 5 independently stained slides). ***P < 0.001 by unpaired t test.

