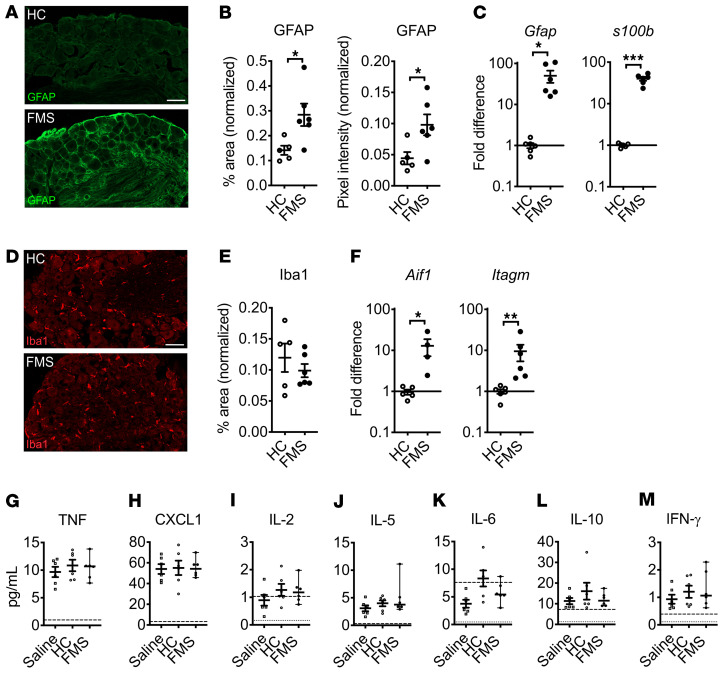
Figure 8. FMS IgG increases signs of satellite glial cell activity in vivo but does not drive systemic inflammation.
DRG from FMS IgG–injected mice have increased GFAP immunoreactivity (A), which is indicative of increased satellite glial cell activity, compared with HC IgG injected mice when the percentage area of GFAP immunoreactivity and GFAP mean pixel intensity are quantified and normalized to the DAPI signal (B). Gfap and s100b gene expression is elevated in the DRG of mice injected with FMS IgG compared with HC IgG (C). The number of Iba1-immunoreactive macrophages was unchanged, as was the percentage area of Iba1 immunoreactivity, when comparing HC IgG– and FMS IgG–injected mice (D and E). Gene expression of Aif1 (Iba1 gene) and Itagm (gene for CD11b, another macrophage marker) was elevated in FMS IgG–injected mice compared with HC IgG–injected mice (F). Scale bars: 50 μm. qPCR data were normalized to Hprt1 expression analyzed using the 2–ΔΔCt method. Serum levels of TNF (G), CXCL1 (H), IL-2 (I), IL-5 (J), IL-6 (K), IL-10 (L), and IFN-γ (M) were measured and there were no differences between groups. The dashed lines indicate the lower limit of quantification (LLOQ) and the dotted lines indicate the lower limit of detection (G–M). Line and whiskers indicate mean ± SEM (n = 4–6). Differences between FMS IgG and HC IgG were analyzed with Mann-Whitney U test (B–F). Cytokine levels were compared between saline, HC, and FMS with 1-way ANOVA followed by Tukey’s post hoc test for each analyte (G–M) except IL-6, which was not analyzed statistically because most values were below the LLOQ. *P < 0.05, **P < 0.01, ***P < 0.001.

