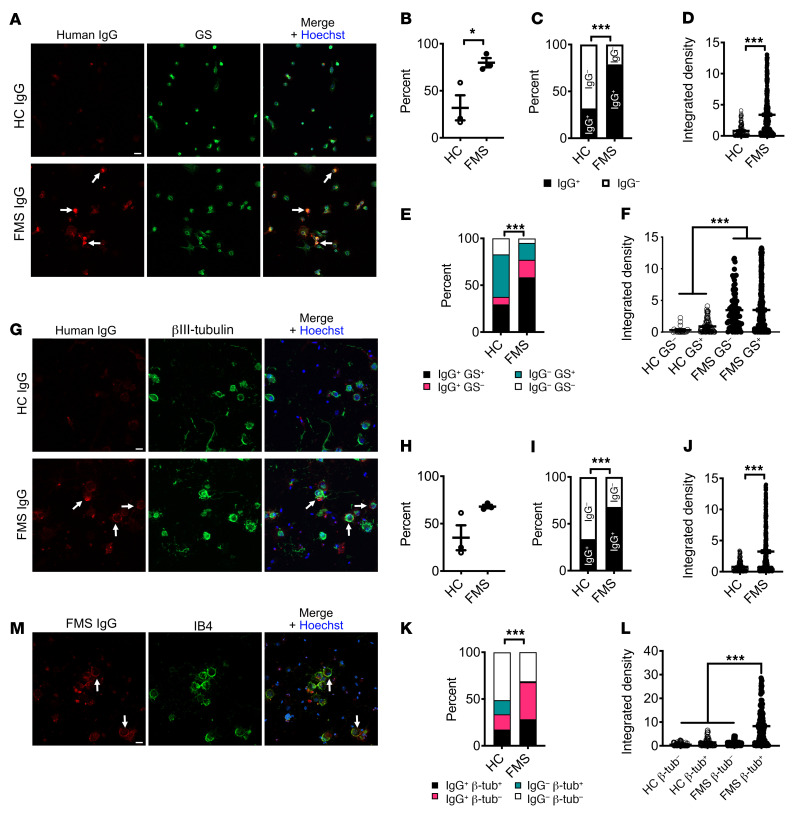
Figure 9. FMS IgG binds to satellite glial cells and to neurons in vitro.
Live cells were incubated with FMS IgG or HC IgG to examine only cell surface binding. In satellite glial cell (SGC) cultures (A), FMS IgG labeled a greater percentage of cells than HC IgG when analyzed per animal (B) and by the total number cells (C). The immunoreactivity, analyzed as signal intensity (integrated density), was higher in cells incubated with FMS IgG than HC IgG (D). FMS IgG labeled SGCs (GS+) and non-SGCs (GS–) to a greater extent (percentage, E) and with a higher intensity (F) than HC IgG. FMS and HC IgG labeling of neuronal cultures (G) was not different when considering the percentage of cells labeled per animal (H), but a difference was observed when the total number of cells was considered (I). The signal intensity was higher for cells exposed to FMS IgG than HC IgG (J). FMS IgG labeled neurons (βIII-tubulin+) and non-neurons (βIII-tubulin–) to a greater extent than HC IgG (K). The signal intensity of FMS IgG binding to neurons was greater than FMS IgG binding to non-neuronal cells and HC IgG binding to all cells (L). FMS IgG and IB4 colocalization (M) indicates that FMS IgG binds neuronal cell membranes. All scale bars: 20 μm. Data points are the percentage of cells bound by HC or FMS IgG (B and H). In D, F, J, and L data points are the integrated density of individual cells across 3 experiments. Bar and whiskers indicate mean ± SEM (n = 3 individual experiments). *P < 0.05; ***P < 0.001 by unpaired t test (B, D, H, and J), χ2 test (C, E, I, and K), or Kruskal-Wallis test with Dunn’s post hoc test (F and L).

