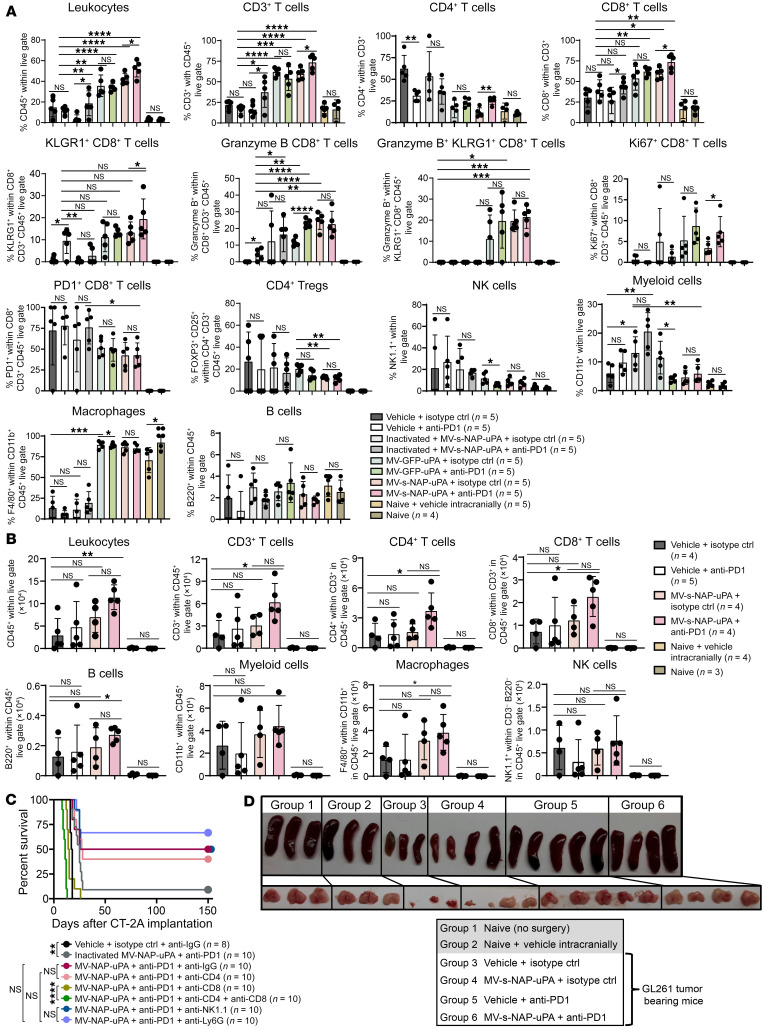
Figure 6. Intratumoral MV-s-NAP-uPA and systemic anti-PD1 immunovirotherapy results in potent cellular immune response against glioblastoma.
Mice bearing (A) CT-2A and (B) GL261 orthotopic tumors were treated according to the schema in Figure 5, B and D, respectively. At the time point that at least 2 mice from the vehicle plus isotype control group exhibited clinical symptoms of GBM disease progression, all groups of mice were sacrificed for analysis of immune cell responses in the brain. Mice were perfused and brains were processed for immunophenotyping. Graph values represent mean ± SD (n = 4–5 mice per group). (C) Mice bearing CT-2A brain tumors were treated with MV-s-NAP-uPA and anti-PD1 antibody as described in Figure 5B in the presence of anti-CD4, -CD8, -CD4 plus -CD8, -NK1.1, and -Ly6G cell-depleting antibodies. Kaplan-Meier survival curves and Benjamini and Hochberg adjustment for multiple comparisons were used to calculate median survival times (n = 8–10 mice per group). (D) Images of spleen and thymus sizes harvested from individual mice after completion of the MV-s-NAP-uPA and/or anti-PD1 treatment of the GL261 glioblastoma model. Untreated naive mice and naive mice injected with saline (vehicle) intracranially were included in the experiment as controls. *P < 0.05; **P < 0.01; ***P < 0.001; ****P < 0.0001 by 2-way ANOVA followed by Tukey’s multiple comparison test. NS, not significant.

