
Figure 4. Functionalization of multiscale hierarchies.
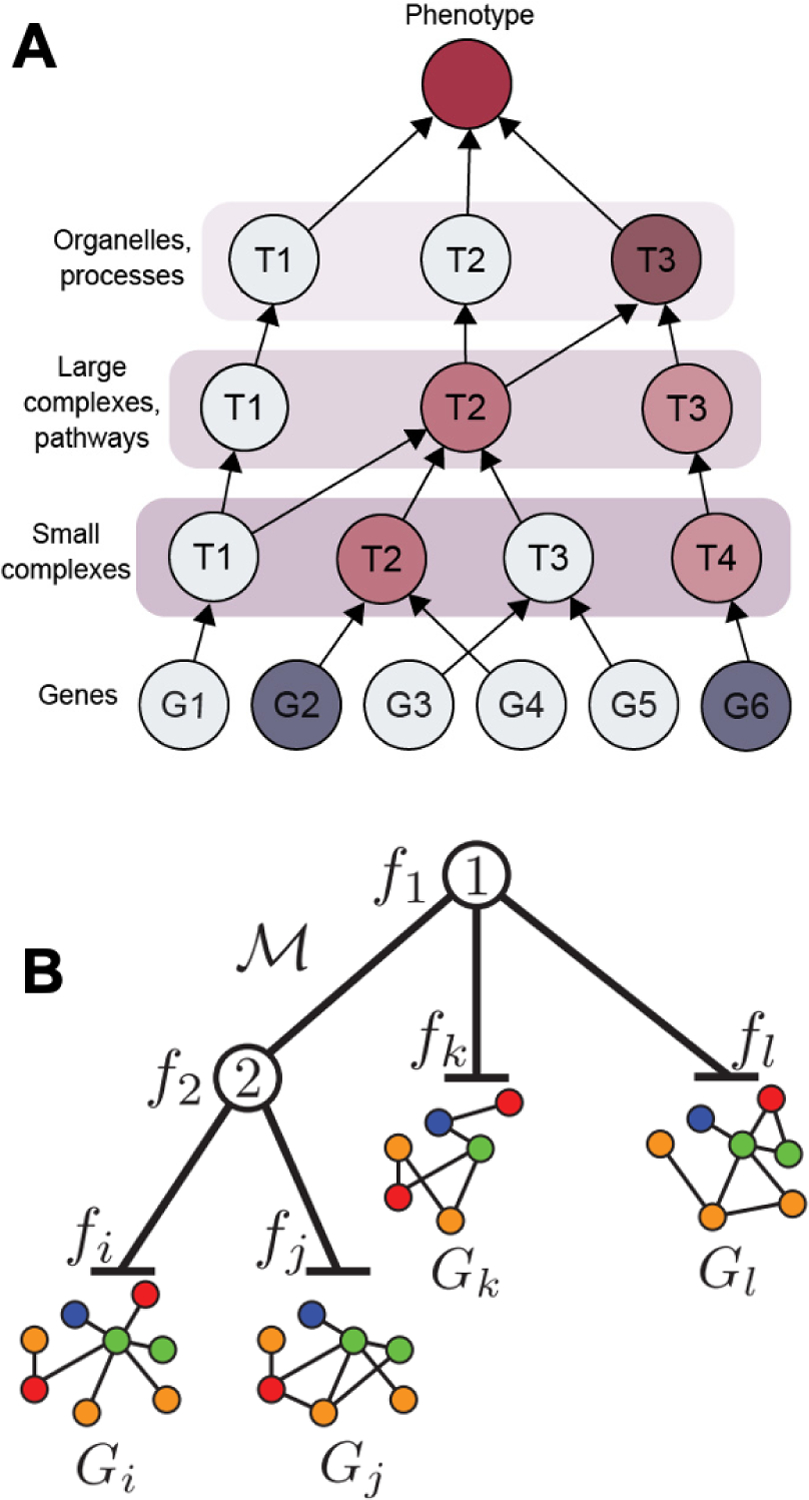
(A) Translation of genotype to phenotype through a hierarchy of subcellular systems. Gene deletions are represented by dark blue. Resulting changes in state for affected systems are shown in red, with darker colors representing effects that are larger or more likely. (B) The OhmNet algorithm learns tissue-specific interactions in a multi-layer network by taking into account tissue hierarchy. OhmNet learns function fi given tissue-specific network graphs Gi in hierarchical model M. Figure 4B reprinted from Zitnik, M., and Leskovec, J. (2017). Predicting multicellular function through multi-layer tissue networks. Bioinformatics 33, i190–i198, by permission of Oxford University Press.