
Figure 5. Visualization of multiscale models as a hierarchy.
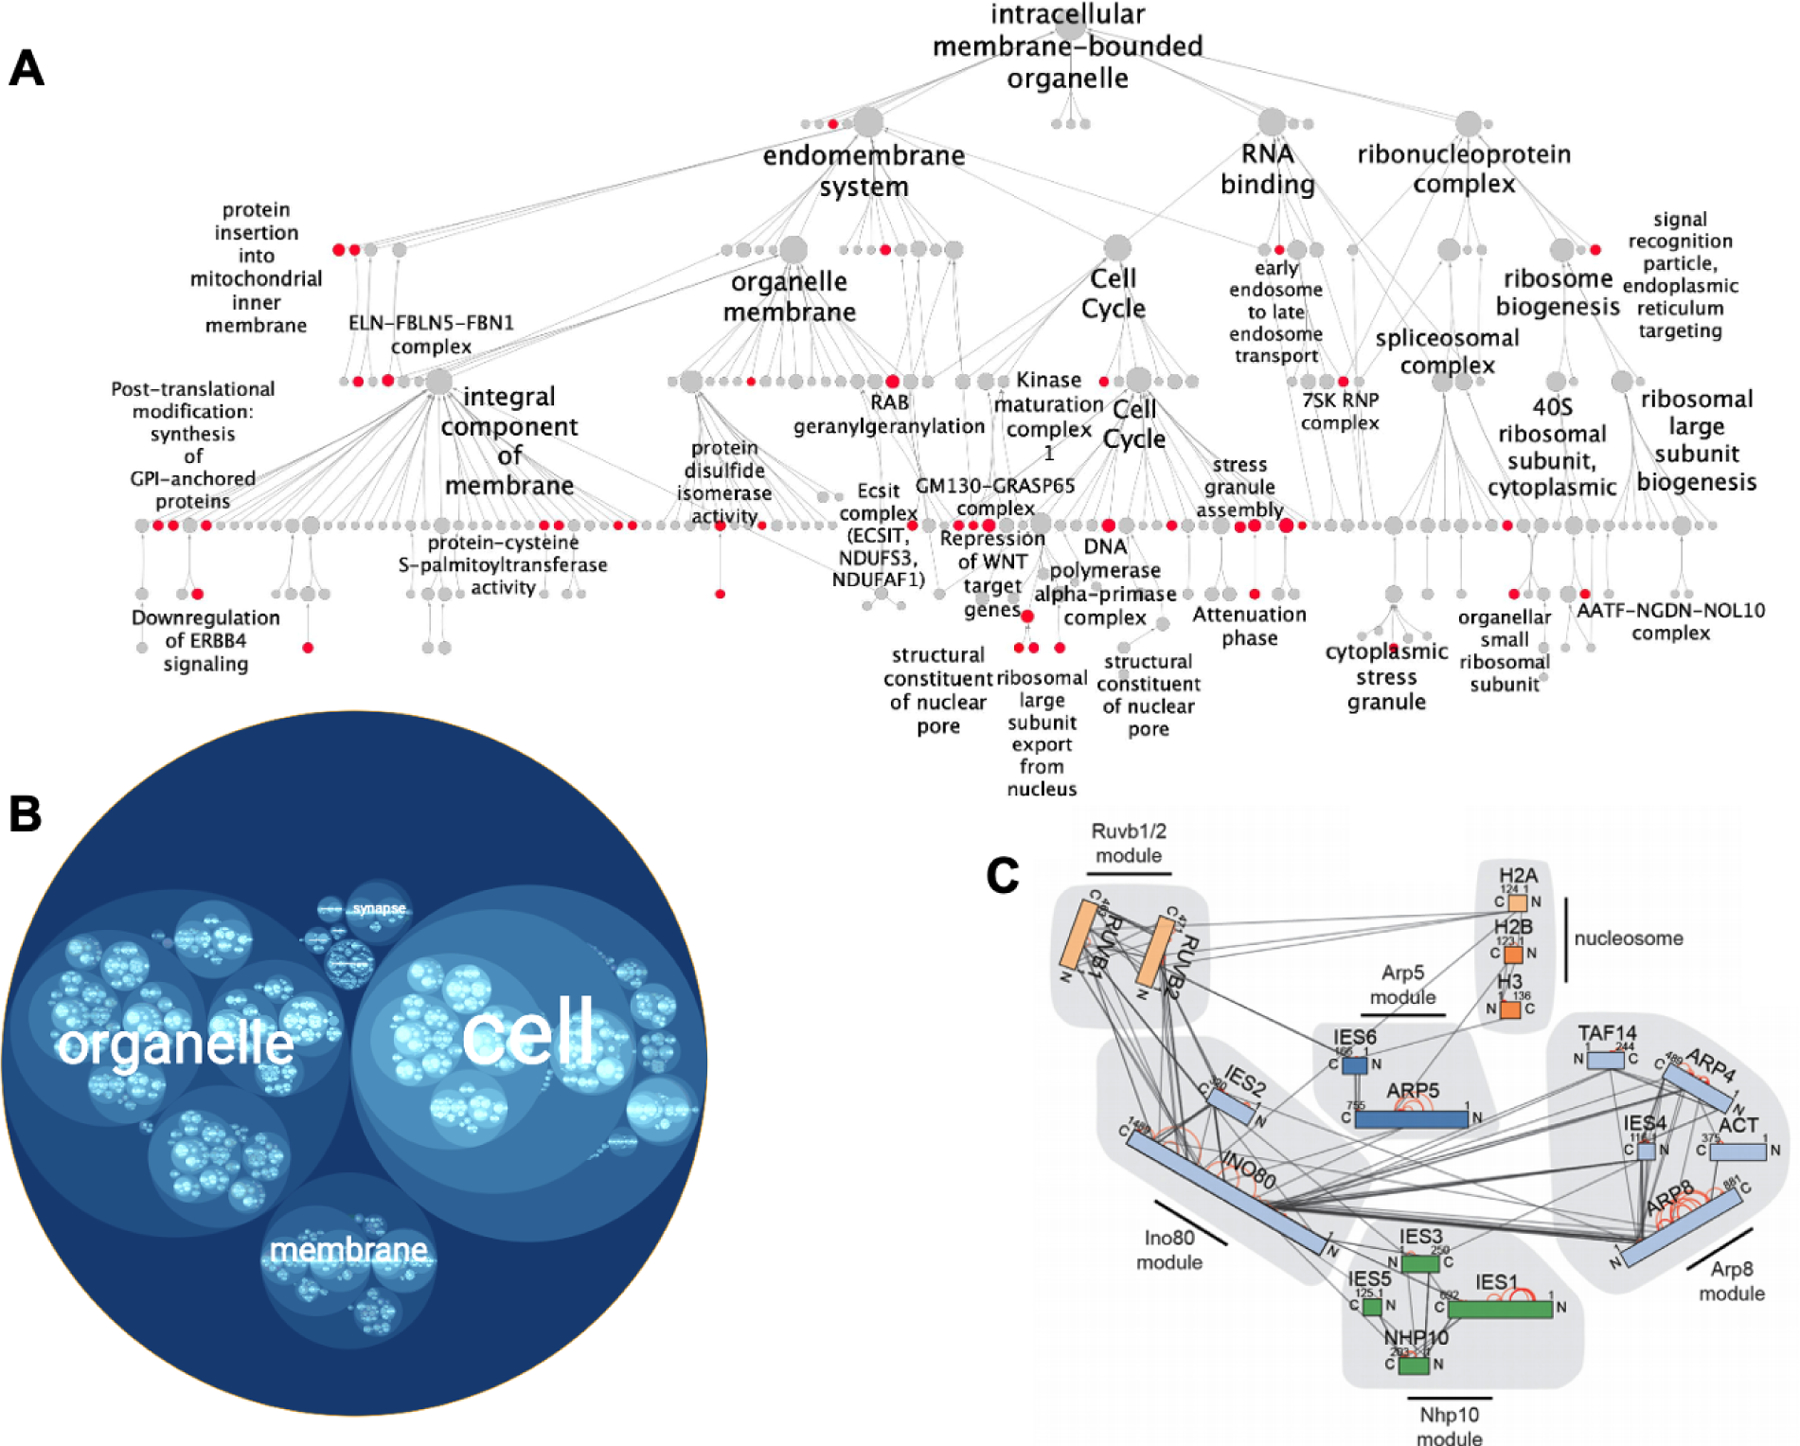
(A) Node-link hierarchy of human protein assemblies interacting with SARS-CoV-2. Red communities are enriched for human proteins that interact with SARS-CoV-2 viral proteins. Figure 5A adapted from Zheng, F., Zhang, S., Churas, C., Pratt, D., Bahar, I., and Ideker, T. (2021). HiDeF: identifying persistent structures in multiscale ‘omics data. Genome Biol. 22, 21., with permission (https://creativecommons.org/licenses/by/4.0/). (B) Circle-packing diagram showing an alternative visualization of the same SARS-CoV-2 hierarchy, generated with HiView. Protein assemblies are represented as circles, with hierarchical containment of one assembly by another represented as nesting of one circle inside another. (C) Hierarchy of protein complexes involving INO80 and the nucleosome, assembled using data from peptide cross-linking analysis. Protein complex modules are highlighted in grey. Rectangle nodes represent proteins, and edges represent crosslinks. Figure 5C reprinted from Grimm, M., Zimniak, T., Kahraman, A., and Herzog, F. (2015). xVis: a web server for the schematic visualization and interpretation of crosslink-derived spatial restraints. Nucleic Acids Res. 43, W362–W369, by permission of Oxford University Press.