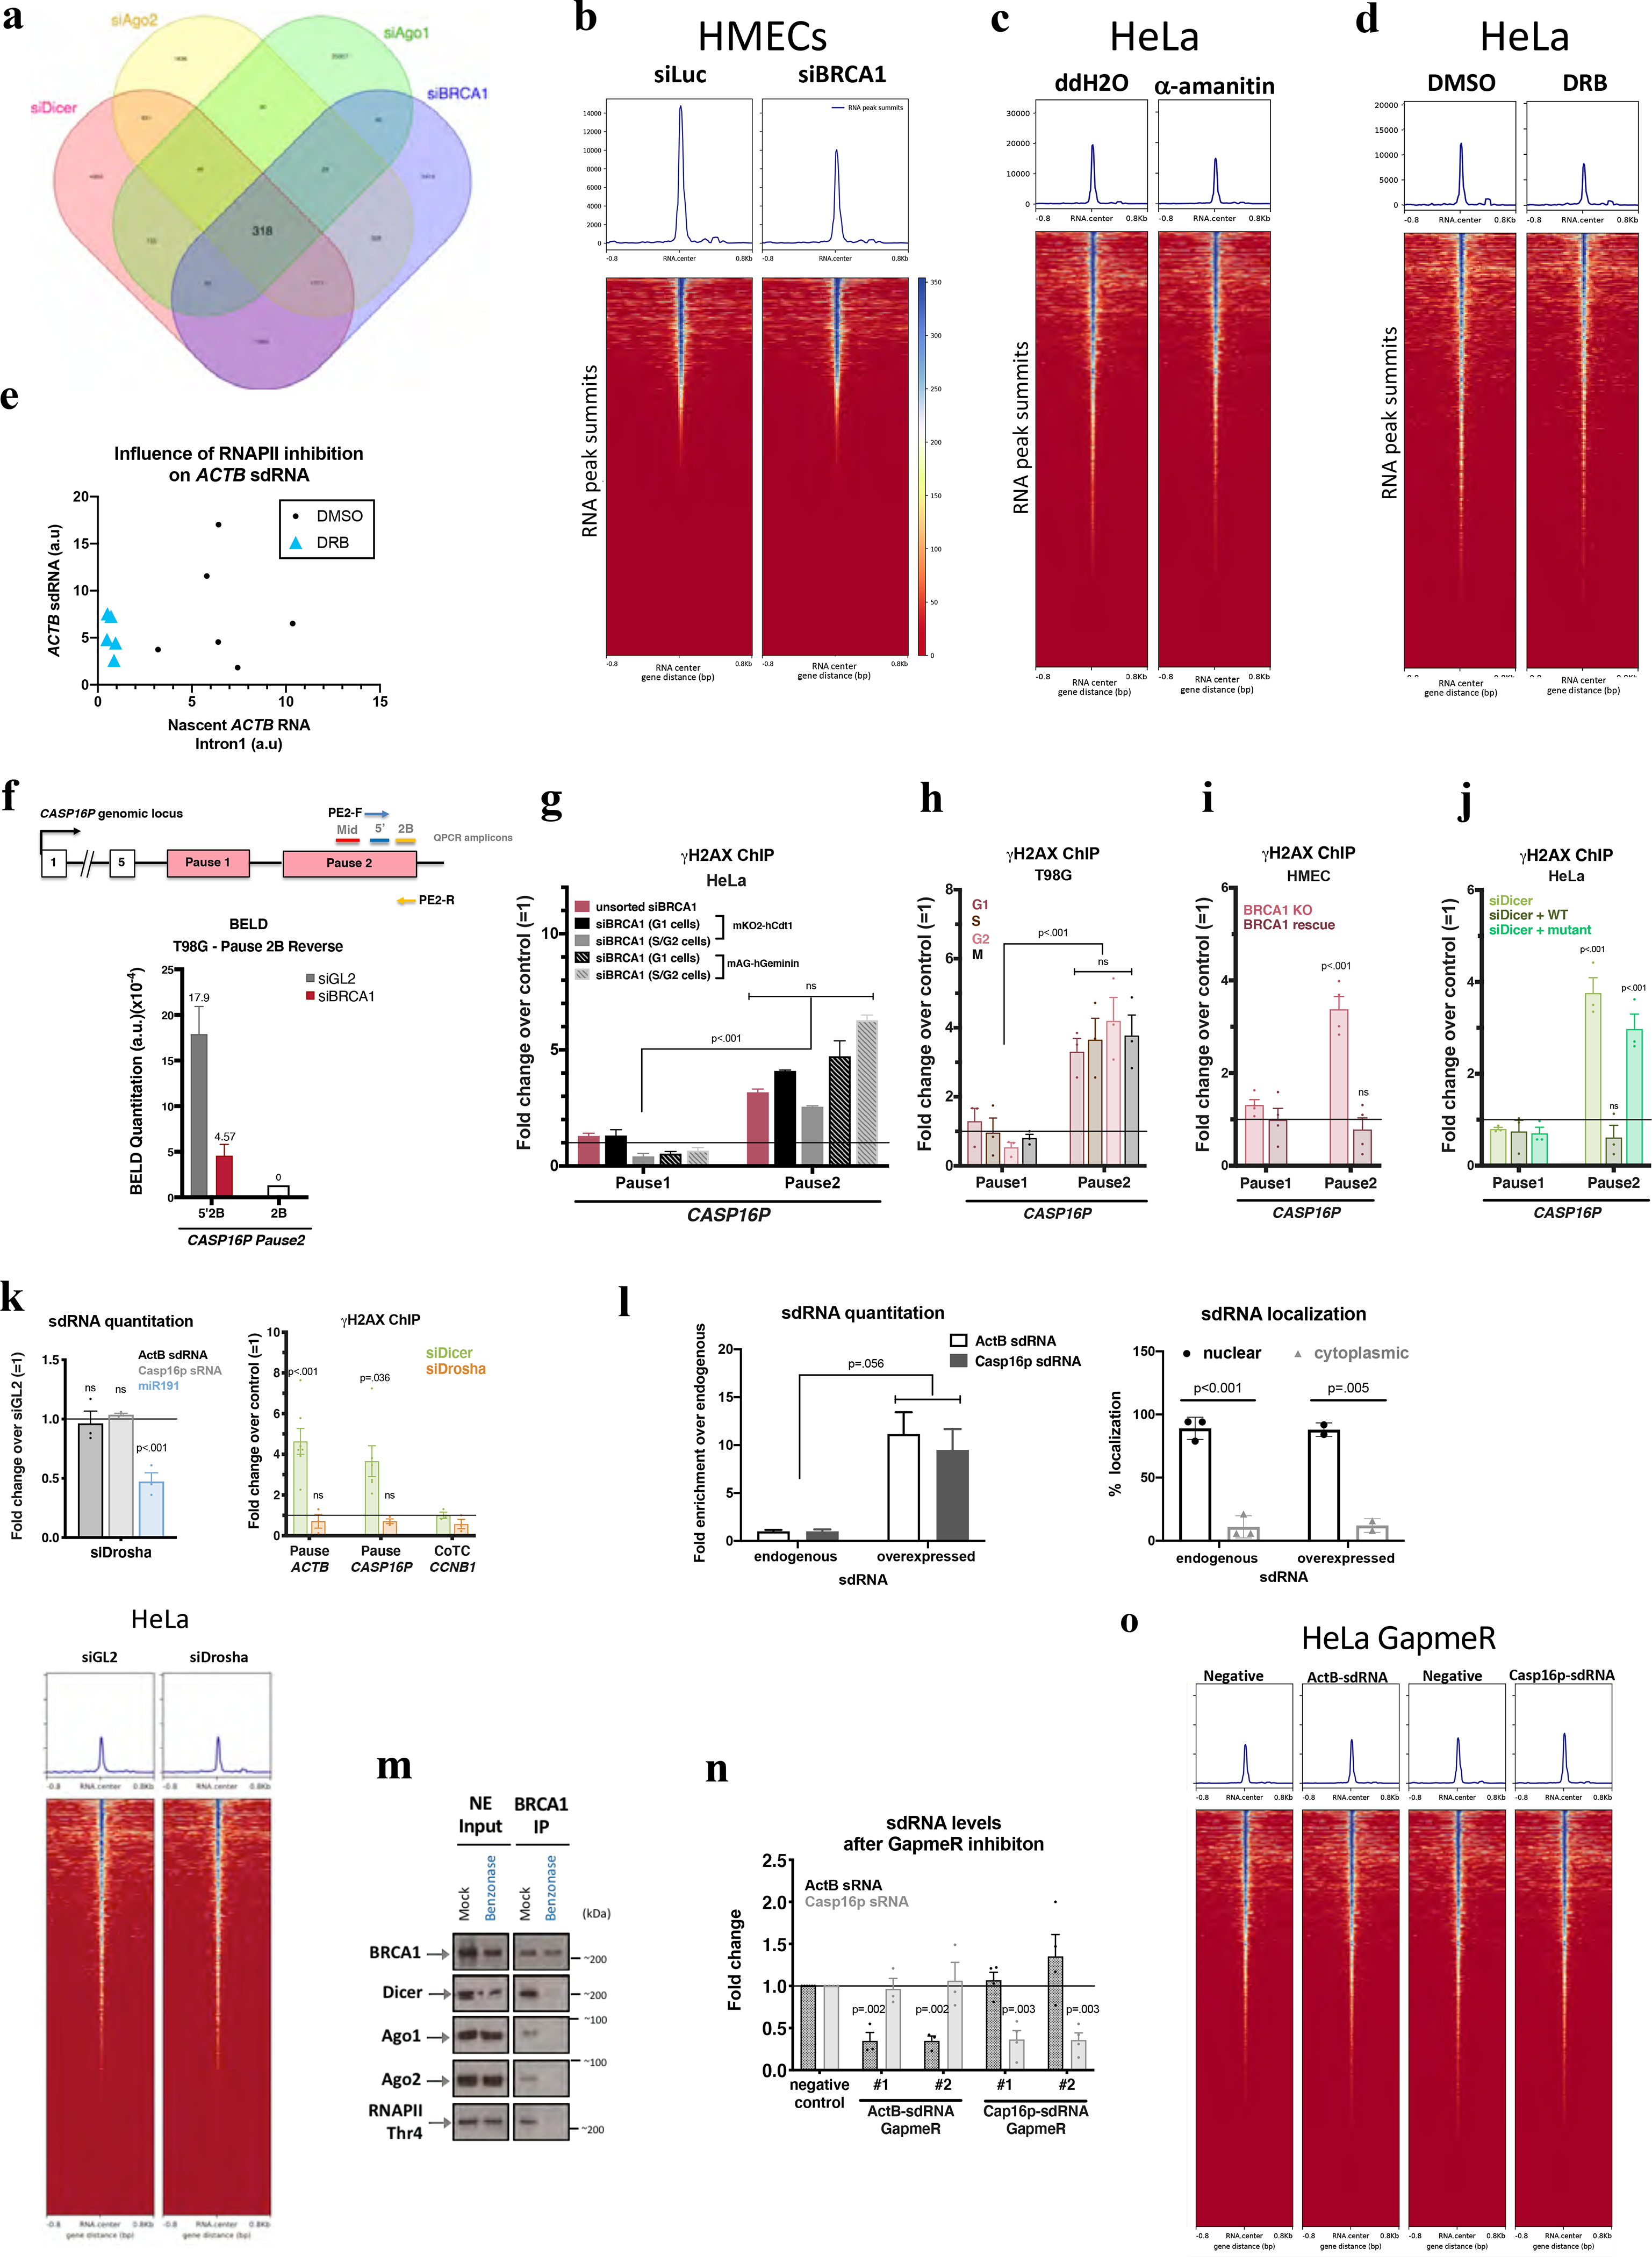
Extended Data Figure 3 |. DNA damage- induction after BRCA1, Dicer, and sdRNA.

a, A Venn diagram showing a common set of deregulated sdRNAs following the indicated depletions. b-d, Heatmaps centered around the sdRNA peaks (+/− 0.8kb) showing effects of α-amanitin (c) and DRB (d) effects. e, Scatter plots suggesting a correlation between the abundance of ActB-sdRNA and the nascent ACTB RNA (detected using Intron1). f, (Top) Schematic of the CASP16P genomic locus. Primers used for BELD on the forward (PE2-F) and reverse (PE2-R) strands and the QPCR amplicons. (Bottom) BELD quantitation in T98G cells of the CASP16P Pause2 site reverse strand. Representative experiment showing the relative average abundance of the qPCR replicates ± s.d. g-j, DNA damage quantitation at the CASP16P pause site performed in G1 or S/G2 BRCA1-depleted HeLa FUCCI cells (representative graph)(g), or in BRCA1-depleted, synchronized T98G (n=3)(h) or in BRCA1 (n=4)(i) or Dicer (n=3)(j) rescue experiments. k, Quantitation of ActB- and Casp16p-sdRNA (top) and (right) genome-wide heatmaps centered around sdRNA peaks, showing that HeLa Drosha depletion didn’t affect sdRNA abundance (mir191=positive control). Average qPCR values ± s.e.m.. (bottom) Drosha depletion did not induce DNA damage at ACTB or CASP16P pause site CCNB1 CoTC is a negative control (n = 3 biological replicates for both graphs). l. Subcellular sdRNA quantitation, endogenously (n=2–3) or upon overexpression (representative). m. Benzonase effect on immunoblotted proteins co-IP’d with BRCA1, n=3. n, Efficacy and specificity of ActB- and Casp16p-sdRNA depletion using individual LNA GapmeRs (n=3–4). o. Heat maps centered around the sdRNA peaks showing no genome-wide effect upon ActB- or Casp16p-sdRNA depletion. γ-H2AX ChIP analyses shown as average fold change compared to relevant control cells. Data were analyzed by One-way (g) or Two-way (h-k, n) Anova with post-hoc Tukey HSD or multiple/unpaired t-test (l) and compared to an undamaged locus, or relevant control cells. ns= non significant.
