Figure 1.

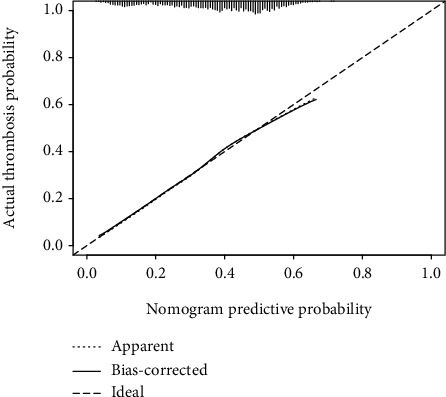
Calibration curve of the clinical prediction model. On the calibration curve, x-axis is the nomogram predicted probability of thrombosis for low limb fracture patients, and y-axis is the actual probability of thrombosis for these patients.

Calibration curve of the clinical prediction model. On the calibration curve, x-axis is the nomogram predicted probability of thrombosis for low limb fracture patients, and y-axis is the actual probability of thrombosis for these patients.