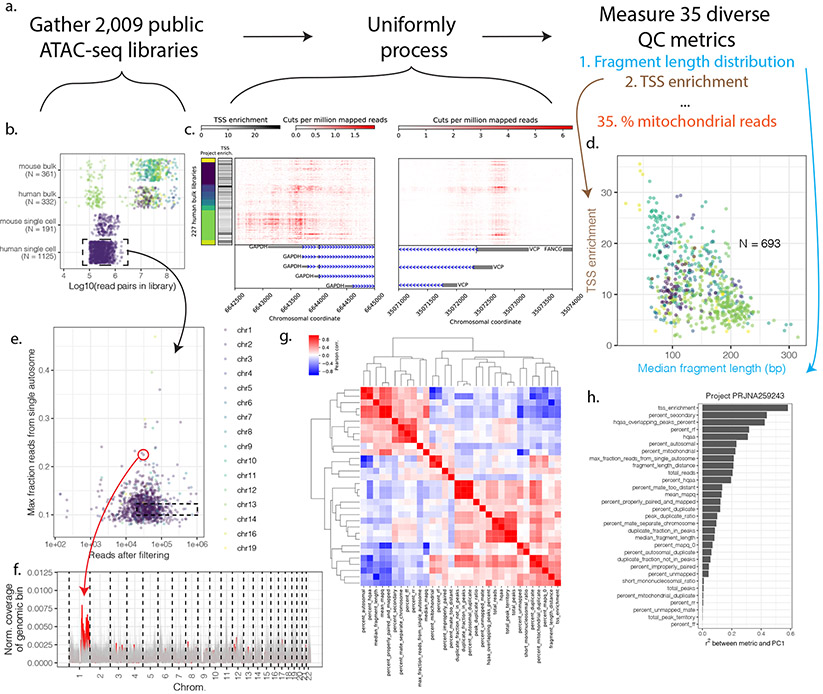
Figure 1. Survey of public ATAC-seq data.
(a) 2,009 public ATAC-seq libraries representing 23.4 billion read pairs were downloaded and uniformly processed. (b) Number of libraries and total read pairs per species and project (colors represent different projects). (c) ATAC-seq signal at promoters of two housekeeping genes (GAPDH and VCP) across human bulk libraries with at least 5M reads post-filtering. Colors along the y-axis represent project. (d) TSS enrichment and median fragment length for the 693 processed bulk (not single cell) datasets. (e) Maximum fraction of autosomal reads derived from a single autosome for public human single-cell ATAC-seq data. (f) Normalized read coverage in 2Mb windows (with 1Mb steps between them) across chromosomes for the outlier circled in red from (e) and for a set of 90 non-outlier cells from the same cell type (GM12878; all lying within the dotted box in (e)). The outlier’s read coverage is represented by the red line; non-outliers are shown in gray. One arm of chromosome 1 shows abnormally high coverage in the outlier cell. (g). Correlation between ataqv metrics across public bulk ATAC-seq datasets. Metric abbreviations are listed in Table S1 (h). Correlation between PC1 and ataqv metrics in project PRJNA259243.

