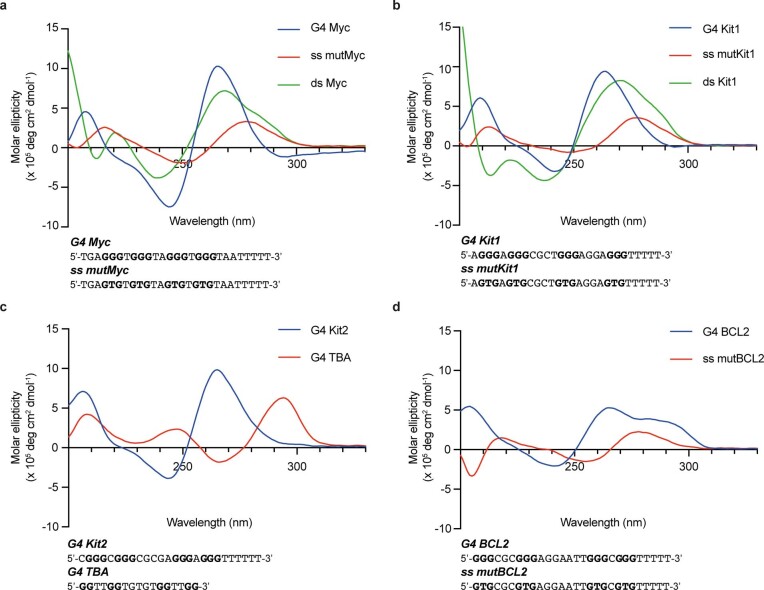
Extended Data Fig. 3. Structure verification of oligonucleotides.
CD spectra obtained here match previously reported spectra of the well-characterized DNA G4 sequences (G-runs are highlighted in bold, see Supplementary Table 3) with different topologies showing distinct bands65,66, including parallel a,G4 Myc b, G4 Kit1 and c, G4 Kit2 by positive at ~260 nm and negative at ~240 nm; anti-parallel G4 TBA by positive at ~290 nm and ~240 nm, and negative at ~260 nm; d, hybrid G4 BCL2 by positive at ~290 nm and ~260 nm, and negative at ~240 nm. All G4 structures also share a positive band at ~210 nm. While the corresponding single-stranded mutant and duplex controls have lost these features. Mean of three independent experiments (n = 3) is represented.

