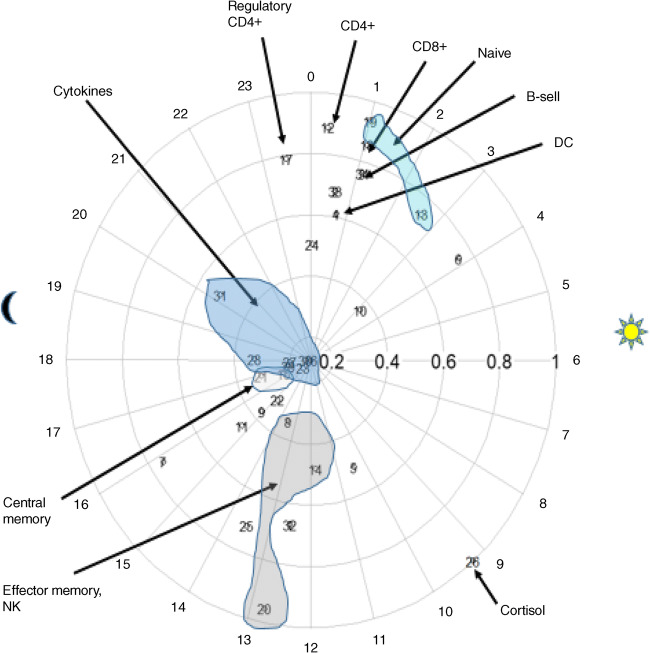
Fig. 2.
Functional synchronisation. Chronograph of immune components measured in type 1 diabetes (shipped samples). Each numbered circle represents an immune component. Placement of the circle on the 24 h ‘clock’ indicates acrophase (time of peak). Amplitude, or height of peak (expressed in standard deviation units), is indicated by distance from the clock centre. Times of sunrise and sunset on the day of the study are indicated by sun and moon symbols. Some data points have been visually grouped by functional phenotype

