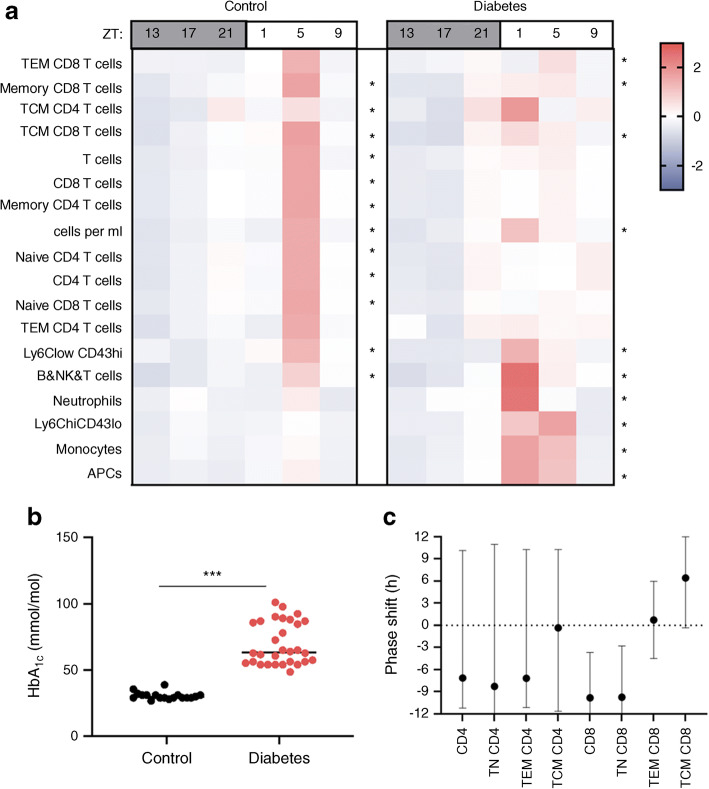
Fig. 3.
Dysrhythmia in the murine type 1 diabetes model. (a) Heatmap of z scores of cell population counts in blood from control (left) and diabetic (right) mice comparing circadian variation between the two. Asterisks indicate significant circadian rhythmicity, *p < 0.05. (b) HbA1c levels in STZ-induced diabetes. (c) Phase shift in STZ-induced diabetes compared with control mice. Data are mean phase difference (diabetic−control) and 95% interval on the difference using percentage data. TEM, effector memory T cells; TCM, central memory T cells; APC, antigen-presenting cells

